. 2006 Feb;18(2):382-96.
doi: 10.1105/tpc.105.037309. Epub 2006 Jan 13.

The A-type cyclin CYCA2;3 is a key regulator of ploidy levels in Arabidopsis endoreduplication

Affiliations
Free PMC article

The A-type cyclin CYCA2;3 is a key regulator of ploidy levels in Arabidopsis endoreduplication

Kumiko K Imai et al. Plant Cell. 2006 Feb.
Free PMC article

Abstract

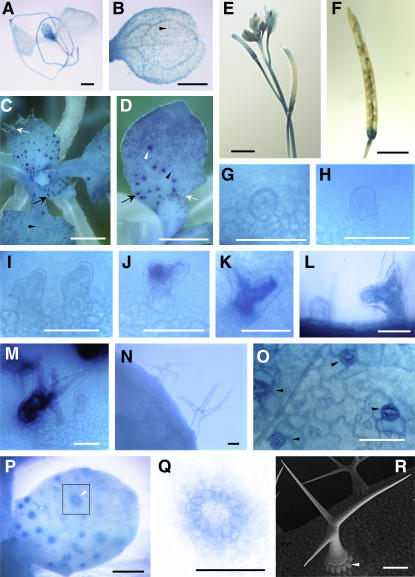
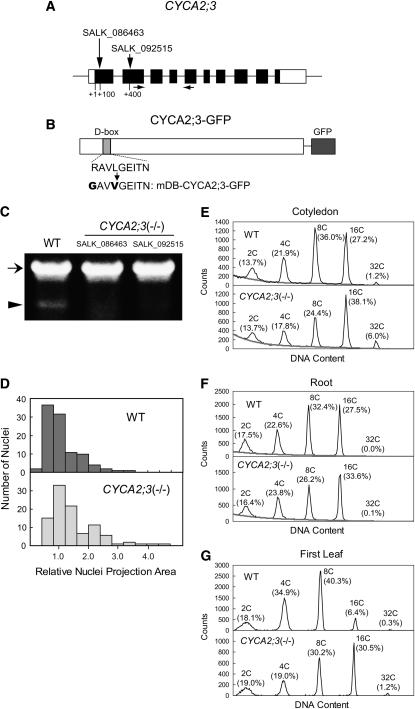
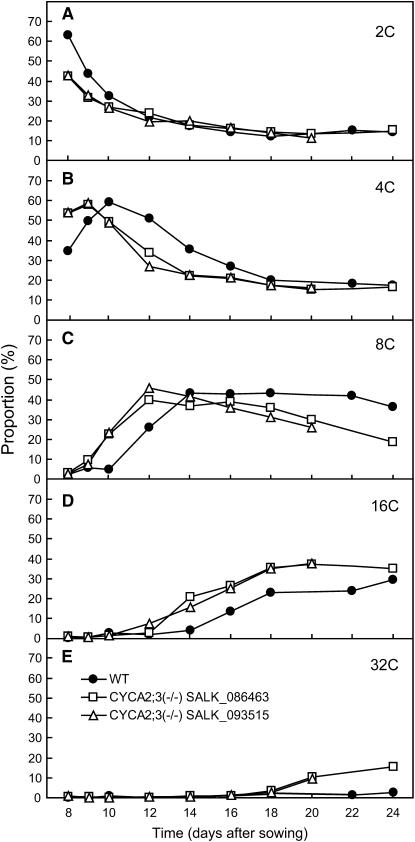
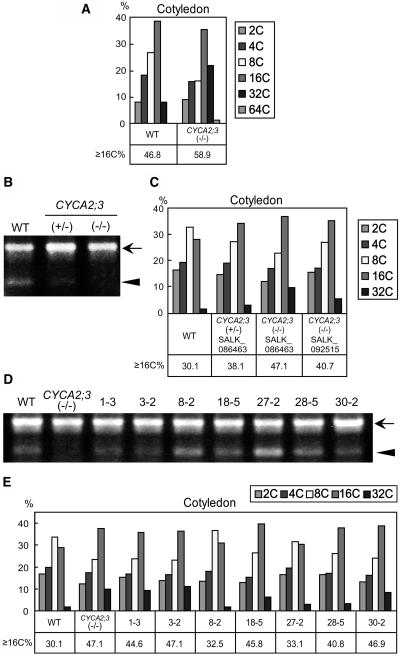
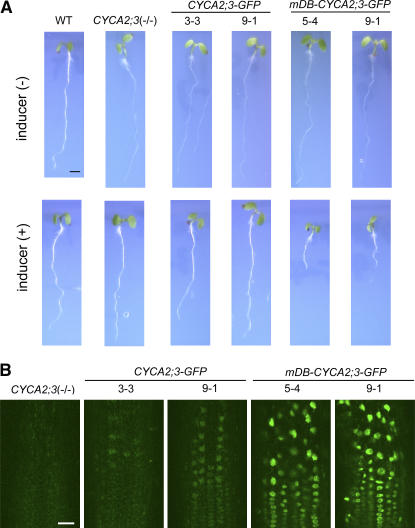
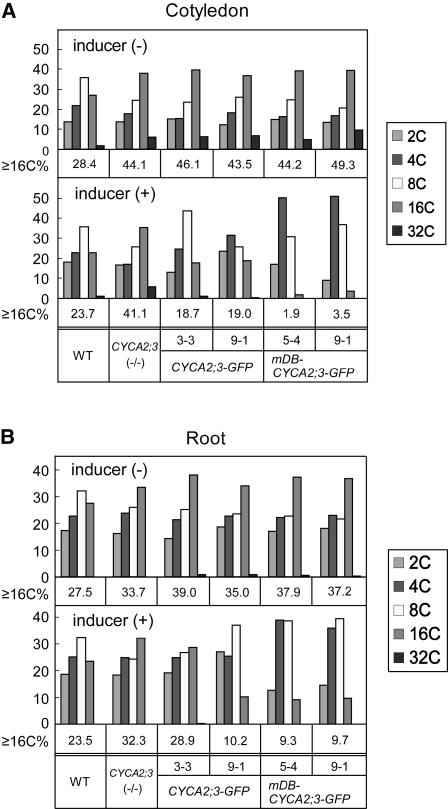
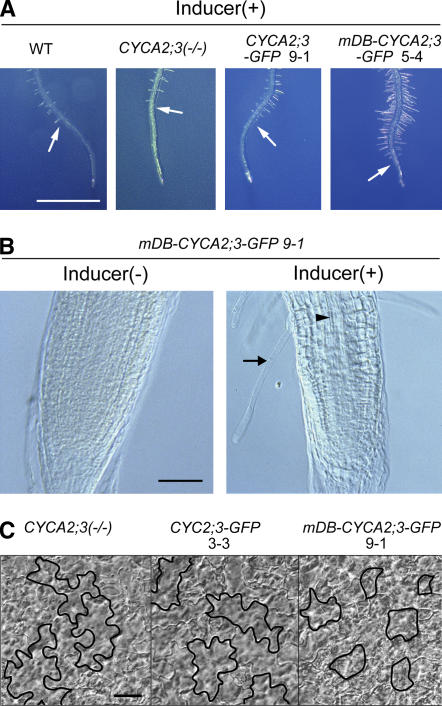
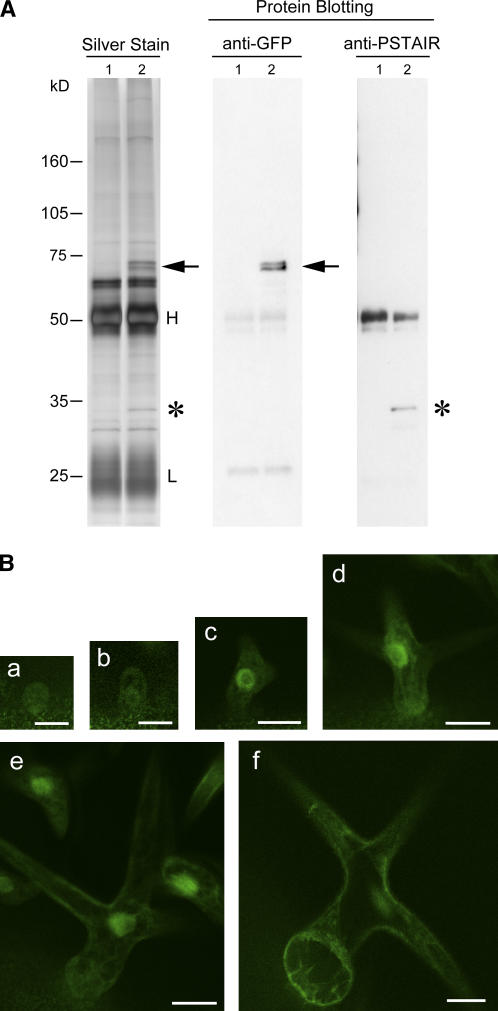
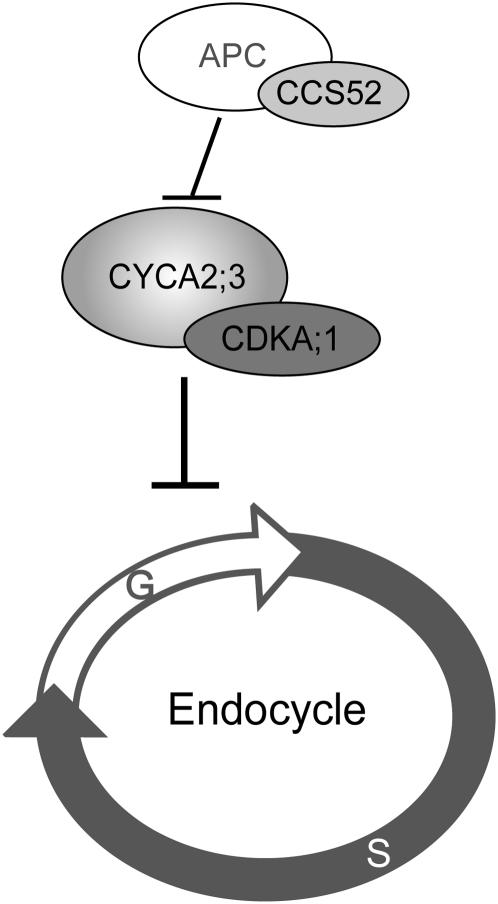
Plant cells frequently undergo endoreduplication, a process in which chromosomal DNA is successively duplicated in the absence of mitosis. It has been proposed that endoreduplication is regulated at its entry by mitotic cyclin-dependent kinase activity. However, the regulatory mechanisms for its termination remain unclear, although plants tightly control the ploidy level in each cell type. In the process of searching for regulatory factors of endoreduplication, the promoter of an Arabidopsis thaliana cyclin A gene, CYCA2;3, was revealed to be active in developing trichomes during the termination period of endoreduplication as well as in proliferating tissues. Taking advantage of the situation that plants encode highly redundant cyclin A genes, we were able to perform functional dissection of CYCA2;3 using null mutant alleles. Null mutations of CYCA2;3 semidominantly promoted endocycles and increased the ploidy levels achieved in mature organs, but they did not significantly affect the proportion of cells that underwent endoreduplication. Consistent with this result, expression of the CYCA2;3-green fluorescent protein fusion protein restrained endocycles in a dose-dependent manner. Moreover, a mutation in the destruction box of CYCA2;3 stabilized the fusion protein in the nuclei and enhanced the restraint. We conclude that CYCA2;3 negatively regulates endocycles and acts as a key regulator of ploidy levels in Arabidopsis endoreduplication.


Figures

Figure 1.
Figure 1.
Histochemical Analysis of CYCA2;3 Promoter Activity. CYCA2;3 promoter activity was histochemically analyzed using a CYCA2;3 promoter–GUS reporter gene that was introduced into wild-type plants. (A) Young seedling at 7 d after germination (DAG). (B) Cotyledons at 5 DAG. (C) Shoot apex. (D) and (P) Young leaves. (E) Inflorescence. (F) Seedpod. (G) to (M) Developing trichomes at stage 2 ([G], [H], and left part of [L]), early stage 3 (I), late stage 3 ([J] and [K]), and stage 4 (right part of [L] and [M]). (N) Mature trichomes. (O) Leaf surface. (Q) Trichome socket cells. (R) Scanning electron microscopic image of a mature trichome and trichome socket cells on the wild-type leaf surface. Black and white arrows in (C) and (D) indicate developing and mature trichomes, respectively. Black and white arrowheads in (B) to (D), (O), (P), and (R) indicate stomata guard cells and trichome socket cells, respectively. A magnification of the region indicated by the square in (P) is shown in (Q). Bars = 1 mm in (A) to (D), 3 mm in (E) and (F), 0.05 mm in (G) to (O), and 0.1 mm in (P) to (R).
Figure 2.
Figure 2.
Analysis of Loss-of-Function Mutations of CYCA2;3. (A) The exon (boxes) and intron (lines) structure of CYCA2;3. Coding and noncoding regions are shown as black and white boxes, respectively. Vertical arrows indicate the sites of the T-DNA insertions in the lines SALK_086463 and SALK_092515. Horizontal arrows indicate the positions of the primers used in RT-PCR analysis. (B) Structure of the fusion protein CYCA2;3-GFP. The amino acid sequence of the D-box and the altered sequence in mDB-CYCA2;3-GFP are shown below. (C) RT-PCR analysis of CYCA2;3 expression in wild-type and CYCA2;3(−/−) plants of the SALK_086463 and SALK_092515 lines. RT-PCR was performed using total RNA prepared from 2-week-old plants. The positions of the bands corresponding to the ACT2 (a positive control; At3g18780) and CYCA2;3 transcripts are indicated by an arrow and an arrowhead, respectively. (D) Comparison of the sizes of nuclei in trichomes of wild-type (top) and CYCA2;3(−/−) (bottom) plants. The nuclei were stained with 4′,6-diamidino-2-phenylindole (DAPI), and the projection area was measured microscopically (see Methods). To calculate the relative value, the mean nuclear projection area from wild-type trichomes was arbitrarily set to 1. (E) to (G) Ploidy distribution patterns in cotyledons (E), roots (F), and first leaves (G) of wild-type (top panels) and CYCA2;3(−/−) (bottom panels) plants. Seedlings grown under normal light conditions for 4 DAG ([E] and [F]) or 14 DAG (G) were dissected and subjected to flow cytometry. Ploidy levels and the proportion of cells with those levels are indicated above each peak. The gray lines in (E) and (F) are the calculated baselines (see Methods).
Figure 3.
Figure 3.
Time-Course Ploidy Distribution Analysis of Mutant First Leaves in Leaf Development. Proportions of cells with ploidy levels of 2C (A), 4C (B), 8C (C), 16C (D), and 32C (E) in wild-type (closed circles) and mutant (SALK_086463, open squares; SALK_092515, open triangles) first leaves harvested at the indicated times were determined by flow cytometry and plotted.
Figure 4.
Figure 4.
Ploidy Distribution Analyses of Cotyledons of Mutant and Complementation Plants. (A) Ploidy distribution analysis of fully expanded cotyledon cells at 7 DAG in wild-type and CYCA2;3(−/−) plants. (B) and (C) Quantitative RT-PCR analysis of the CYCA2;3 transcript (B) and ploidy distribution analysis of cotyledon cells at 4 DAG (C) in wild-type, heterozygous [CYCA2;3(+/−) SALK_086463 line], and homozygous [CYCA2;3(−/−) SALK_086463 and SALK_092515 lines] mutant plants. (D) and (E) Quantitative RT-PCR analysis of CYCA2;3 (or CYCA2;3-GFP) transcripts (D) and ploidy distribution analysis of cotyledon cells at 4 DAG (E) in the wild type, CYCA2;3(−/−), and the complementation lines (1-3, 3-2, 8-2, 18-5, 27-2, 28-5, and 30-2) containing the CYCA2;3-GFP gene driven by the CYCA2;3 promoter. Quantitative RT-PCR was performed using total RNA from 2-week-old plants. The positions of the bands corresponding to the ACT2 (a positive control) and CYCA2;3 (or CYCA2;3-GFP) transcripts are indicated by the arrow and arrowhead, respectively. Ploidy distribution analysis was performed by flow cytometry of cells from cotyledons. The proportions of cells with the indicated ploidy levels were calculated (see Methods). ≥16C%, the proportion (%) of cells with a ploidy level of 16C or higher.
Figure 5.
Figure 5.
Macroscopic Phenotypes of Mutant and Transgenic Seedlings, and Subcellular Localization Patterns of the GFP Fusion Proteins. (A) Seedlings of the wild type, CYCA2;3(−/−), and transgenic lines containing the inducible CYCA2;3-GFP (lines 3-3 and 9-1) or mDB-CYCA2;3-GFP (lines 5-4 and 9-1) gene in the CYCA2;3(−/−) background. Seedlings grown for 4 DAG on agar medium lacking (top row) or containing (bottom row) 10 μM β-estradiol are shown. Bar = 2 mm. (B) Fluorescence in inducer-treated CYCA2;3(−/−) roots and roots inducibly expressing CYCA2;3-GFP (lines 3-3 and 9-1) or mDB-CYCA2;3-GFP (lines 5-4 and 9-1) in the CYCA2;3(−/−) background. Seedlings were grown for 7 DAG on agar medium lacking β-estradiol and then for 3 d on agar medium containing 10 μM β-estradiol. The fluorescence from the GFP fusion proteins was observed using confocal laser-scanning microscopy. As a negative control for GFP fluorescence, CYCA2;3(−/−) roots were observed under the same conditions used for the CYCA2;3-GFP lines. Bar = 0.02 mm.
Figure 6.
Figure 6.
Ploidy Distribution Analysis of Transgenic Plants Ectopically Expressing CYCA2;3-GFP or mDB-CYCA2;3-GFP. Ploidy distributions in cotyledons (A) and roots (B) of the wild type, CYCA2;3(−/−), and transgenic lines expressing CYCA2;3-GFP (lines 3-3 and 9-1) or mDB-CYCA2;3-GFP (lines 5-4 and 9-1) in the CYCA2;3(−/−) background are shown. Cotyledons and roots from seedlings grown for 4 DAG on agar medium lacking (top panels) or containing (bottom panels) 10 μM β-estradiol were subjected to flow cytometry, and the proportions of cells with the indicated ploidy levels were calculated (see Methods). ≥16C%, the proportion (%) of cells with a ploidy level of 16C or higher.
Figure 7.
Figure 7.
Phenotypes of Roots and Cotyledon Epidermal Cells in Plants Expressing CYCA2;3-GFP or mDB-CYCA2;3-GFP. (A) Phenotypes of root apical regions in the wild type, CYCA2;3(−/−), and transgenic lines containing the inducible CYCA2;3-GFP (line 9-1) or mDB-CYCA2;3-GFP (line 5-4) gene in the CYCA2;3(−/−) background. Root apical regions of seedlings grown for 4 DAG on agar medium containing 10 μM β-estradiol are shown. Arrows indicate the positions of root hair initiation. Bar = 2 mm. (B) Internal structure of root tips of a transgenic line containing the inducible mDB-CYCA2;3-GFP gene in the CYCA2;3(−/−) background (line 9-1). Root tips of seedlings grown for 4 DAG on agar medium lacking (left) or containing (right) 10 μM β-estradiol were observed with Nomarski differential interference contrast (DIC) microscopy. Arrows and arrowheads indicate a root hair cell and a tracheary element, respectively. Bar = 0.1 mm. (C) Adaxial cotyledon epidermal cells of CYCA2;3(−/−) and transgenic lines containing the inducible CYCA2;3-GFP (line 3-3) or mDB-CYCA2;3-GFP (line 9-1) gene in the CYCA2;3(−/−) background were observed with Nomarski DIC microscopy. Cotyledons of seedlings grown for 4 DAG on agar medium lacking or containing 10 μM β-estradiol were observed. The shapes of some pavement cells are traced with boldface lines for clarity. Bar = 0.02 mm.
Figure 8.
Figure 8.
Physical Interaction between mDB-CYCA2;3-GFP and CDKA;1 in Planta, and Intracellular Localization of CDKA;1-GFP in Developing Trichomes. (A) Detection of CDKA;1 in protein complexes containing mDB-CYCA2;3-GFP. Seedlings of CYCA2;3(−/−) (control; lane 1) and mDB-CYCA2;3-GFP (line 9-1; lane 2) were grown for 7 DAG on agar medium lacking β-estradiol and then for 3 d on agar medium containing 10 μM β-estradiol. Protein extracts prepared from their roots were used in an immunoprecipitation experiment with an anti-GFP antibody. Immunoprecipitates were fractionated by SDS-PAGE and then visualized by silver staining (left) or subjected to protein gel blot analysis with the anti-GFP antibody (center) or an antibody specific to the peptide sequence PSTAIR (right). Arrows and asterisks indicate signal bands at the expected positions of mDB-CYCA2;3-GFP and CDKA;1, respectively. H and L indicate the positions of the heavy and light chains, respectively, of the antibody used in immunoprecipitation. The positions of molecular mass standards are indicated at left. (B) Intracellular localization analysis of CDKA;1-GFP in developing trichomes. The fusion protein CDKA;1-GFP was expressed using the truncated CDKA;1 promoter, which contains developing trichome specific activity (Imajuku et al., 2001). The fluorescence from the GFP moiety was observed using confocal laser scanning microscopy. Developing trichomes at stage 2 ([a] and [b]), stage 3 (c), stage 4 (d), early stage 5 (e), and late stage 5 (f) are shown. Bars = 0.025 mm in (a) and (b) and 0.05 mm in (c) to (f).
Figure 9.
Figure 9.
Model for the Signal Cascade Negatively Regulating Endocycles through the Function of CYCA2;3. A hypothesis for a signal cascade that negatively regulates endocycles is illustrated. CYCA2;3/CDKA;1 negatively regulates the rate of entry into the DNA synthesis phase of each endocycle. CYCA2;3 is downregulated through protein degradation mediated by APC, the activation of which possibly involves the function of CCS52. Other A2-type cyclins may have the same function as CYCA2;3. T bars indicate negative regulation.

References

    1. Blow, J.J., and Dutta, A. (2005). Preventing re-replication of chromosomal DNA. Nat. Rev. Mol. Cell Biol. 6 476–486. - PMC - PubMed
    1. Boudolf, V., Vlieghe, K., Beemster, G.T.S., Magyar, Z., Torres Acosta, J.A., Maes, S., Van Der Scheren, E., Inzé, D., and De Veylder, L. (2004). The plant-specific cyclin-dependent kinase CDKB1;1 and transcription factor E2Fa-DPa control the balance of mitotically dividing and endoreduplicating cells in Arabidopsis. Plant Cell 16 2683–2692. - PMC - PubMed
    1. Burssens, S., de Almeida Engler, J., Beeckman, T., Richard, C., Shaul, O., Ferreira, P., Van Montagu, M., and Inzé, D. (2000). Developmental expression of the Arabidopsis thaliana CycA2;1 gene. Planta 211 623–631. - PubMed
    1. Castellano, M.M., del Pozo, J.C., Ramirez-Parra, E., Brown, S., and Gutierrez, C. (2001). Expression and stability of Arabidopsis CDC6 are associated with endoreplication. Plant Cell 13 2671–2686. - PMC - PubMed
    1. Cebolla, A., Vinardell, J.M., Kiss, E., Olah, B., Roudier, F., Kondorosi, A., and Kondorosi, E. (1999). The mitotic inhibitor ccs52 is required for endoreduplication and ploidy-dependent cell enlargement in plants. EMBO J. 18 4476–4484. - PMC - PubMed

Publication types

MeSH terms