. 2006 Jan;2(1):e11.
doi: 10.1371/journal.pgen.0020011. Epub 2006 Jan 13.

Genome-scale identification of membrane-associated human mRNAs

Affiliations

Genome-scale identification of membrane-associated human mRNAs

Maximilian Diehn et al. PLoS Genet. 2006 Jan.

Abstract

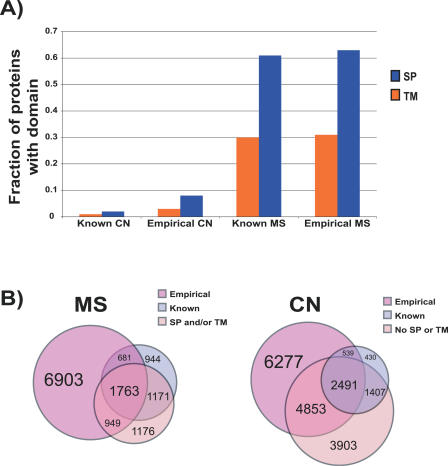
The subcellular localization of proteins is critical to their biological roles. Moreover, whether a protein is membrane-bound, secreted, or intracellular affects the usefulness of, and the strategies for, using a protein as a diagnostic marker or a target for therapy. We employed a rapid and efficient experimental approach to classify thousands of human gene products as either "membrane-associated/secreted" (MS) or "cytosolic/nuclear" (CN). Using subcellular fractionation methods, we separated mRNAs associated with membranes from those associated with the soluble cytosolic fraction and analyzed these two pools by comparative hybridization to DNA microarrays. Analysis of 11 different human cell lines, representing lymphoid, myeloid, breast, ovarian, hepatic, colon, and prostate tissues, identified more than 5,000 previously uncharacterized MS and more than 6,400 putative CN genes at high confidence levels. The experimentally determined localizations correlated well with in silico predictions of signal peptides and transmembrane domains, but also significantly increased the number of human genes that could be cataloged as encoding either MS or CN proteins. Using gene expression data from a variety of primary human malignancies and normal tissues, we rationally identified hundreds of MS gene products that are significantly overexpressed in tumors compared to normal tissues and thus represent candidates for serum diagnostic tests or monoclonal antibody-based therapies. Finally, we used the catalog of CN gene products to generate sets of candidate markers of organ-specific tissue injury. The large-scale annotation of subcellular localization reported here will serve as a reference database and will aid in the rational design of diagnostic tests and molecular therapies for diverse diseases.


Conflict of interest statement

Competing interests. The authors have declared that no competing interests exist.

Figures

Figure 1
Figure 1. DNA Microarray Analysis of Subcellular mRNA Populations
(A) Moving average analyses of the fraction of mRNAs encoding MS proteins. Data for two representative fractionations are shown. In each case, well-measured array elements representing characterized genes were extracted, and the local enrichment for MS-encoding genes (window size = 151) was calculated as a function of the Cy5/Cy3 ratio. The horizontal line represents the overall fraction of MS genes on the microarrays used in these experiments. (B) Discovery rate analysis for the identification of MS and CN genes. A representative microarray hybridization was chosen for each cell line and the total nonredundant number of classified MS or CN genes (UniGene clusters) was calculated after each new fractionation.
Figure 2
Figure 2. Large-Scale Categorization of MS and CN Genes
We evaluated the ability of various array element-specific parameters to classify genes encoding MS (A) or CN (B) proteins, using receiver operator analysis. Based on these analyses, we chose the average log2 Cy5/Cy3 ratio for assigning the final localization annotations (see text and Protocol S1). The curves were generated by incrementally relaxing the parameter cutoff values to generate gene sets with varying fractions of known MS- or CN-encoding genes. (C) Relationship between sensitivity, specificity, fraction of characterized genes encoding MS proteins, and the total number of clones classified as MS, using the average log2 Cy5/Cy3 ratio as the selection criteria. The vertical arrows indicate two cutoffs used for subsequent analyses. (D) Same as in (C) but for genes encoding CN proteins.
Figure 3
Figure 3. Comparison of Empirical Classifications of MS and CN Genes with In Silico Prediction Methods
(A) We were able to retrieve curated, NP protein accessions for 5,504 of the well-measured UniGene clusters on our arrays. The prediction algorithms used were SignalP (HMM/Smean score method) [33] for SPs and TMHMM (first60 score cutoff greater than 10) [34] for TM domains. In order to calculate the fraction of proteins within a category that contained a given motif, the overlap between that category and the genes with protein sequences was used. (B) Venn diagrams showing the overlap between the empirically determined cDNA clones, clones with in silico predictions, and clones encoding proteins with known subcellular localization. For this analysis, we were able to retrieve representative protein accessions for 10,006 cDNA clones from UniGene and applied the prediction algorithms as in (A).
Figure 4
Figure 4. Expression of MS Genes in Human Malignancies and Normal Tissues
Gene expression profiles for 745 tumor and normal specimens were generated on the same types of microarrays used for the fractionation experiments. Array elements representing MS genes that varied more than 3-fold from the median on at least three microarrays were included. The data are displayed as a hierarchical cluster where rows represent genes (UniGene clusters) and columns represent experimental samples. Colored pixels capture the magnitude of the response for any gene, where shades of red and green represent induction and repression, respectively, relative to the median for each gene. Black pixels reflect no change from the median and gray pixels represent missing data. For clarity of display, tumor and normal samples for each tumor type were hierarchically clustered separately and then arranged by the order derived from clustering their mean centroids (see Protocol S1). The positions of several genes are indicated.
Figure 5
Figure 5. Identification of MS Tumor Markers
Array elements were ranked based on the difference between the median expression in tumor samples of a given class and the 95th percentile expression level across all normal tissue samples. The dataset was selected in a similar fashion as for Figure 4 (see Protocol S1). Only array elements that passed data quality filters for at least 40% of normal tissues and at least 50% of one or more tumor classes were considered. The top 50 genes for each tumor class are shown, and the positions of several genes are indicated. Brain, lung, and breast tumors were divided into their previously known histologic and molecular subtypes. GBM, glioblastoma multiforme; oligo, oligoastrocytoma/oligodendroglioma; adeno, adenocarcinoma; SCC, squamous cell carcinoma.
Figure 6
Figure 6. Identification of Markers of Organ-Specific Injury
The top-20 CN array elements for each normal tissue were selected using a Student's t-test comparing each normal tissue to all other normal tissues. All normal tissues represented by at least five microarray experiments in Figure 4 were included (150 microarrays). Only array elements that passed data quality filters for at least 70% of all normal tissue experiments were considered. Data are displayed as in Figure 4, and the positions of several genes are indicated.

References

    1. Brekke OH, Sandlie I. Therapeutic antibodies for human diseases at the dawn of the twenty-first century. Nat Rev Drug Discov. 2003;2:52–62. - PubMed
    1. Sturgeon C. Practice guidelines for tumor marker use in the clinic. Clin Chem. 2002;48:1151–1159. - PubMed
    1. Fischbach FT. A manual of laboratory and diagnostic test. Baltimore: Lippincott Williams and Wilkins; 2003. 1312. p.
    1. Tashiro K, Tada H, Heilker R, Shirozu M, Nakano T, et al. Signal sequence trap: A cloning strategy for secreted proteins and type I membrane proteins. Science. 1993;261:600–603. - PubMed
    1. Chen H, Leder P. A new signal sequence trap using alkaline phosphatase as a reporter. Nucleic Acids Res. 1999;27:1219–1222. - PMC - PubMed

Publication types