. 2006 Feb;4(2):e38.
doi: 10.1371/journal.pbio.0040038. Epub 2006 Jan 24.

Hem-1 complexes are essential for Rac activation, actin polymerization, and myosin regulation during neutrophil chemotaxis

Affiliations

Hem-1 complexes are essential for Rac activation, actin polymerization, and myosin regulation during neutrophil chemotaxis

Orion D Weiner et al. PLoS Biol. 2006 Feb.

Abstract

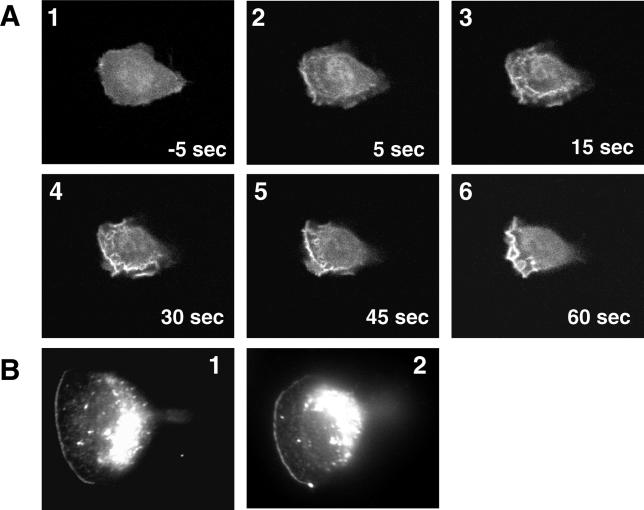
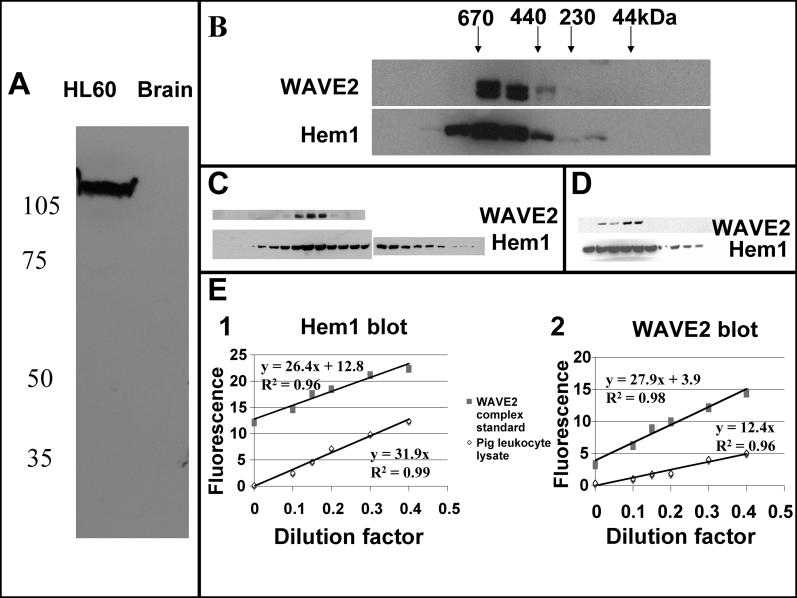
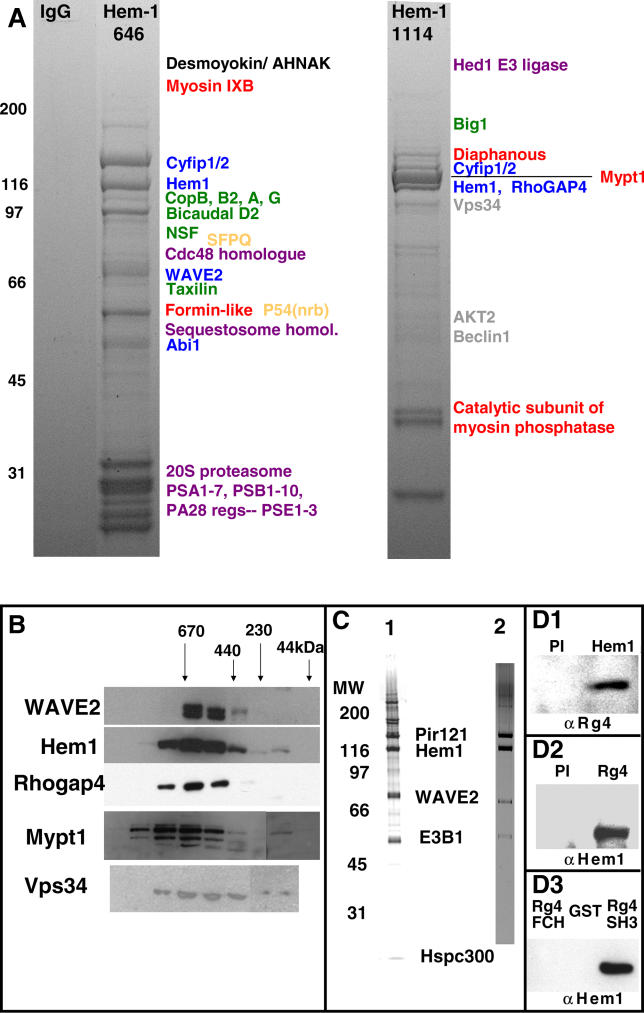
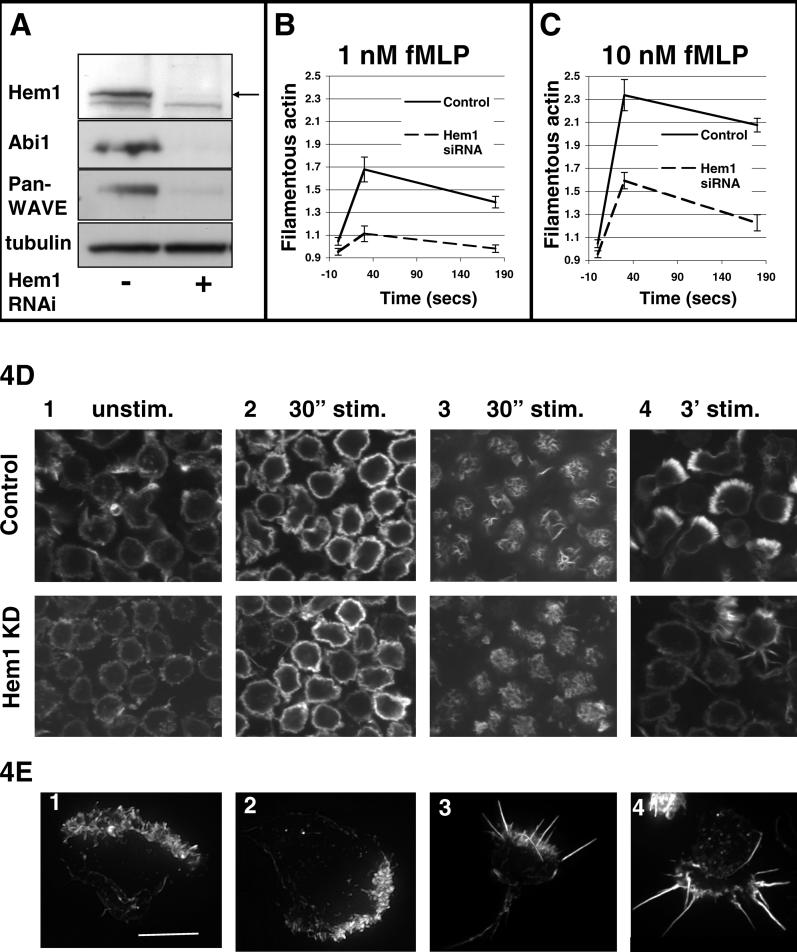
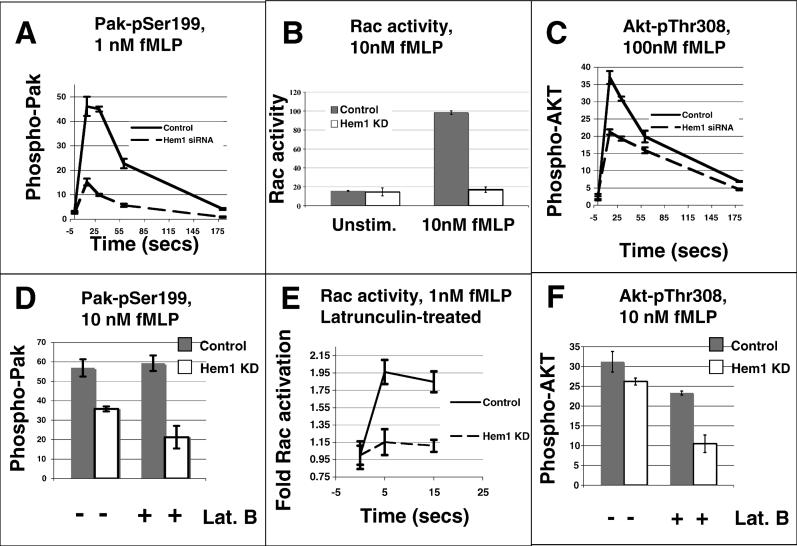
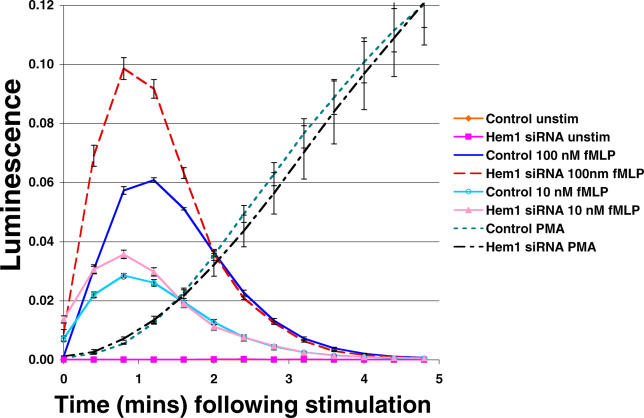
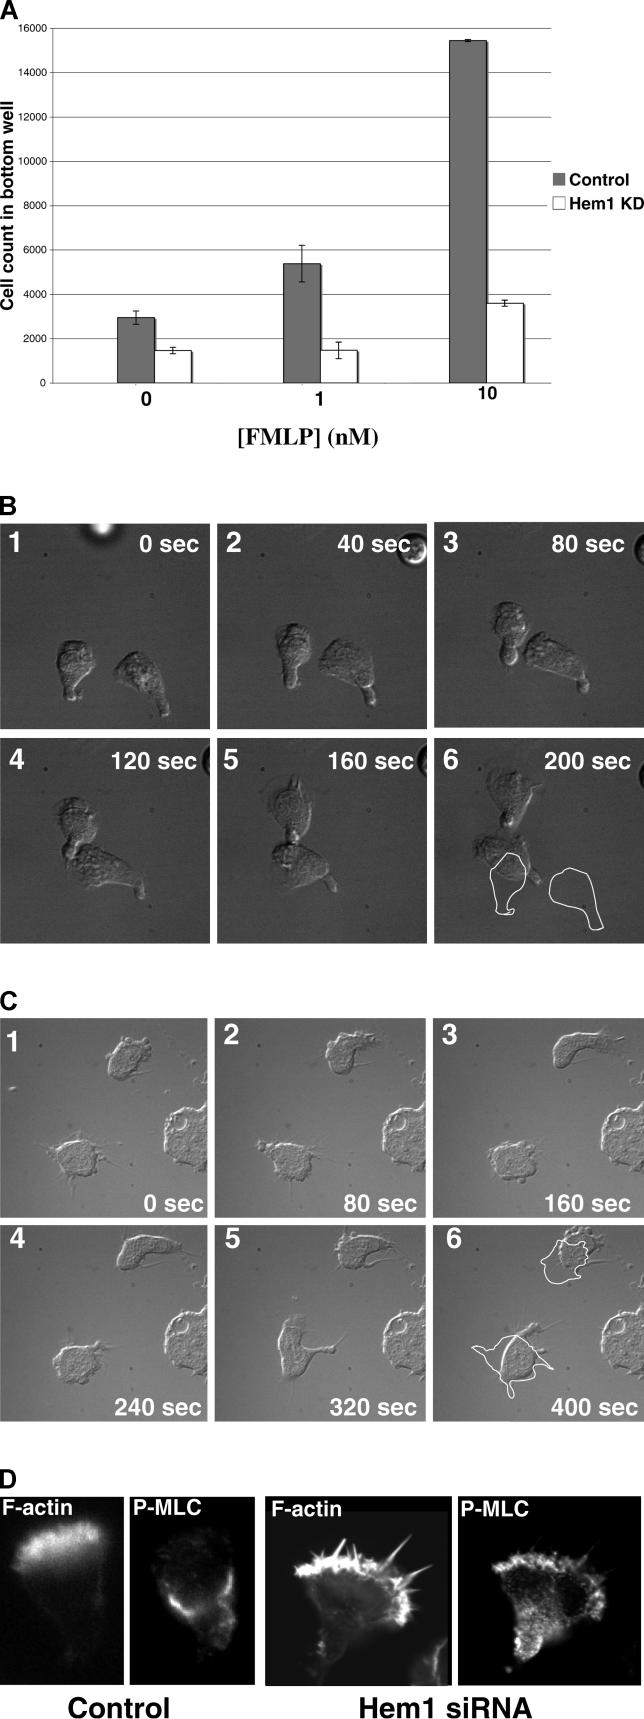
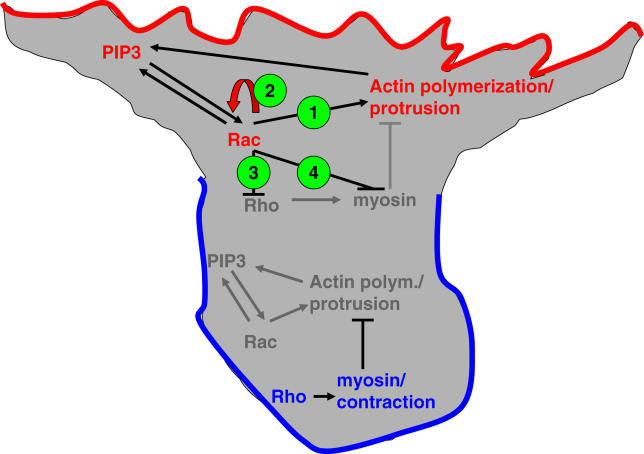
Migrating cells need to make different actin assemblies at the cell's leading and trailing edges and to maintain physical separation of signals for these assemblies. This asymmetric control of activities represents one important form of cell polarity. There are significant gaps in our understanding of the components involved in generating and maintaining polarity during chemotaxis. Here we characterize a family of complexes (which we term leading edge complexes), scaffolded by hematopoietic protein 1 (Hem-1), that organize the neutrophil's leading edge. The Wiskott-Aldrich syndrome protein family Verprolin-homologous protein (WAVE)2 complex, which mediates activation of actin polymerization by Rac, is only one member of this family. A subset of these leading edge complexes are biochemically separable from the WAVE2 complex and contain a diverse set of potential polarity-regulating proteins. RNA interference-mediated knockdown of Hem-1-containing complexes in neutrophil-like cells: (a) dramatically impairs attractant-induced actin polymerization, polarity, and chemotaxis; (b) substantially weakens Rac activation and phosphatidylinositol-(3,4,5)-tris-phosphate production, disrupting the (phosphatidylinositol-(3,4,5)-tris-phosphate)/Rac/F-actin-mediated feedback circuit that organizes the leading edge; and (c) prevents exclusion of activated myosin from the leading edge, perhaps by misregulating leading edge complexes that contain inhibitors of the Rho-actomyosin pathway. Taken together, these observations show that versatile Hem-1-containing complexes coordinate diverse regulatory signals at the leading edge of polarized neutrophils, including but not confined to those involving WAVE2-dependent actin polymerization.


Figures

Figure 1
Figure 1. Hem-1 Strongly Polarizes following Uniform Stimulation of HL-60 cells
(A) Differentiated HL-60 cells expressing GFP-tagged Hem-1 were exposed to uniform 20 nM fMLP (at t = 0 s) and imaged with a spinning disk confocal microscope at 5-s intervals at 37 °C. See Video S1. (B) Human neutrophils obtained from finger pinprick [80] were exposed to uniform 20 nM fMLP for 3 min, fixed, and immunostained for endogenous Hem-1. Hem-1 immunostaining is observed at the leading edge of polarized cells (and also bright staining in the cytosol).
Figure 2
Figure 2. Hem-1 Component of WAVE Regulatory Complex Exists in Pools outside the WAVE2 Complex
(A) Hem-1 antibody specifically recognizes Hem-1 and not the more ubiquitous Hem2/Nap125 homolog. Western blot of equal amounts of differentiated HL-60 (human neutrophil-like cell) and mouse brain lysate with antibodies directed against Hem-1. The Hem-1 antibody also fails to react against 293 lysates (data not shown). (B) Gel filtration of neutrophil-like HL-60 cell lysate blotted for Hem-1 and WAVE2. Note that both proteins migrate primarily as large complexes that generally cofractionate, but Hem-1 is also present in high-molecular-weight fractions that are devoid of WAVE2. The positions of molecular weight standards (thyroglobin, ferritin, catalase, and albumin) are noted. (C, D) Chromatograms of leukocyte lysate during WAVE2 complex purification. The WAVE2 complex was purified from pig leukocytes using conventional chromatography and antibodies to WAVE2 to determine which fractions to pool. (C) HiTrap S chromatogram (of 0% to 40% ammonium sulfate cut of pig leukocyte lysate) blotted for Hem-1 and WAVE2. Note a broader distribution of Hem-1 versus WAVE2. (D) HiTrap Q chromatogram (of the peak WAVE2 fractions from the HiTrap S column) blotted for Hem-1 and WAVE2. Note a broader distribution of Hem-1 versus WAVE2. Subsequent chromatography of the WAVE2-reactive fractions from the Q column yields superimposable profiles for Hem-1 and WAVE2 are (data not shown). (E) Quantitation of Hem-1 and WAVE2 in pig leukocyte lysates. Partially purified WAVE2 complex was used to quantitate relative concentrations of Hem-1 and WAVE2 in pig leukocyte lysates. The ratio of all of the components of the WAVE2 complex is 1:1 in the purified complex. Protein concentrations can be determined by fitting a single point to a standard curve or by comparing two dilution series to one another. The latter is a more accurate means to calculate protein concentration. When plotted from 0× to 1× dilution on the x-axis, the ratio of the slopes of two dilution series indicates their relative concentrations. The WAVE2 complex was serially diluted into pig leukocyte lysate (top curves—dilution into lysate is necessary because some proteins blot differently in buffer versus lysate) or pig leukocyte lysate was serially diluted into buffer (bottom curves). Both blots (Hem-1 and WAVE2) are from the same dilution series and the same gel. For this experiment, 14.8 nM WAVE2 complex standard and 1:20 pig leukocyte lysate represent 1× dilution (from which the 0.1×, 0.2×, 0.3×, and 0.4× dilutions were prepared). The relative slopes of the curves in each blot indicate concentration of proteins in the lysate versus the WAVE2 standard. Thus, for this experiment, the Hem-1 concentration in pig leukocyte lysate (E1) is 31.9/26.4 or 1.2× the concentration of the WAVE2 complex standard. Thus, 1.2 × 14.8 (concentration of Hem1 in Wave2 complex standard) × 20 (dilution factor of pig lysate) = approximately 360 nM Hem-1 in a 1× pig leukocyte lysate. Similarly, WAVE2 (E2) is 12.4/27.9 or 0.45× the concentration of the WAVE2 complex standard. Thus, 0.45 × 14.8 (concentration of WAVE2 in 2 complex standard) × 20 (dilution factor of pig lysate) = approximately 130 nM WAVE2 in a 1× pig leukocyte lysate. Curves represent averages of experiments performed in duplicate.
Figure 3
Figure 3. Antibodies to the Hem-1 Component of the WAVE Regulatory Complex Immunoprecipitate Potential Polarity Effectors in Addition to the WAVE2 Complex
(A) Two milliliters of neutrophil-like differentiated HL-60 lysate (containing 10 mg of protein) were immunoprecipitated with one of two Hem-1 antibodies, raised against an internal region of Hem-1 (646–659) or the C-terminus of Hem-1 (1114–1127), and eluted with the corresponding peptides. The same immunoprecipitation and elution were performed with purified rabbit IgG as a control. The gel was stained with Gelcode Blue. Mass spectrometry–based protein IDs are noted at approximate gel slice position. Colors of proteins indicate major functional classes. Blue, expected components of WAVE2 complex; red, regulators of actin and myosin; green, proteins implicated in vesicle or mRNA trafficking; gray, proteins implicated in lipid signaling; yellow, splicing factors; and purple, proteins implicated in protein degradation. (B) Several of the proteins that coimmunoprecipitate with Hem-1 run as large protein complexes. Crude HL-60 lysate was analyzed by gel filtration on Superose 6 and blotted with antibodies to Hem-1, WAVE2, RhoGAP4, the regulatory subunit of myosin light chain phosphatase (Mypt1), or Vps34 (class III PI3K). The positions of molecular weight standards (thyroglobin, ferritin, catalase, and albumin) are noted. (C) Silver-stained SDS-PAGE of Superose 6 peak of conventionally purified native pig leukocyte WAVE2 complex, including protein identifications (C1). All proteins were identified via mass spectrometry with the exception of Hspc300. Alternatively, antibodies to Hem-1 (646–659) were used to immunoprecipitate the WAVE2 complex from the Superose 6 WAVE2 peak to unambiguously distinguish WAVE2 components from remaining contaminants (C2). Besides the expected core components of the WAVE2 complex, no other Hem-1–associated proteins were identified via mass spectrometry in the purified native pig leukocyte WAVE2 complex. (D) Endogenous Hem-1 and RhoGAP4 reciprocally immunoprecipitate. (1) HL-60 lysates were immunoprecipitated with either Hem-1 or preimmune antisera, eluted, and blotted with RhoGAP4 antibodies. RhoGAP4 signal represents approximately 1% of input. (2) HL-60 lysates were immunoprecipitated with either RhoGAP4 or preimmune antisera, eluted, and blotted with Hem-1 antibodies. Hem-1 signal represents approximately 1% of input. (3) The SH3 domain of RhoGAP4 is sufficient for interaction with Hem-1. GST-tagged RhoGAP4 SH3 was incubated with HL-60 lysate, eluted with glutathione, and blotted for Hem-1. The FCH domain of RhoGAP4 and GST alone fail to pull down Hem-1 from lysates.
Figure 4
Figure 4. Actin Polymerization and Polarity Are Dependent on Hem-1
(A) RNAi-mediated inhibition of endogenous Hem-1 protein expression and degradation of WAVE complex proteins in HL-60 cells. Whole cell lysates were prepared from control cells and siRNA-expressing cells as described. Equal amounts of lysate were used to determine expression of Hem-1, Abi-1, and pan-WAVE by Western blotting. Tubulin levels are shown as a loading control. (B, C) Actin polymerization is dependent on Hem-1. Differentiated HL-60 cells were treated with or without 1 nM fMLP (B) or 10 nM fMLP (C) for 30 s or 3 min, as indicated. After fixation, F-actin content was assessed by staining with Alexa647-conjugated phalloidin and quantified by FACS analysis. Absolute actin levels are shown for each condition (averages of control and Hem-1 knockdown cell Alexa 647 staining was used to normalize for FACS variation and staining intensity between experiments). Standard error of mean for six experiments is shown. (D) Cell polarity is dependent on Hem-1. Control and Hem-1 knockdown cells were stimulated in suspension with or without uniform fMLP (20 nM final concentration) for 30 s or 3 min, fixed and stained with rhodamine phalloidin to visualize filamentous actin, and visualized with spinning disk confocal microscopy. Unstimulated cells are nonpolar with minimal filamentous actin accumulation (1). Both control and knockdown cells uniformly accumulate F-actin at 30 s following stimulation (2). However, knockdown cells exhibit a more diffuse actin accumulation than control cells (3 is focal plane at top surface of cells in 2). Following 3 min of stimulation (4), 80% of wild-type cells polarize (1,106 of 1,387), compared with only 19% of Hem-1 knockdown cells (291 of 1,544). (E) siRNA-mediated Hem-1 silencing alters the morphology of the leading edge. Adherent cells were stimulated by a uniform concentration of fMLP (10 nM) for 3 min, fixed, and stained with rhodamine-conjugated phalloidin. Fluorescent images were captured as described. (1, 2) Control cells. (3, 4) Hem-1 knockdown cells. Fifty-five percent of Hem-1 knockdown cells (110 of 200) and 4.4% of control cells (11 of 248) exhibit spikes at the leading edge.
Figure 5
Figure 5. Rac Activation and PIP3 Generation Are Dependent on Hem-1
Control or Hem-1 knockdown cells were stimulated in suspension with the indicated dose of agonist. TCA was used to stop the reaction (A, C, D, F) and precipitate proteins for immunoblotting or cells were lysed with NP-40, and Rac-GTP was captured with the Rac-binding domain of PAK (B, E). Western blots were quantitated using fluorescent secondary antibodies and the Odyssey system. The y-axis indicates integrated (background-subtracted) fluorescence of secondary antibody on blots in arbitrary units. All experiments were performed in triplicate and are shown with standard error of mean. (A) Effect of Hem-1 depletion on phosphorylation of PAK (readout of Rac activation) for cells treated with 1 nM fMLP. (B) Effect of Hem-1 depletion on Rac activation (assayed with PAK GBD pulldown) for cells treated with 10 nM fMLP for 15 s. (C) Effect of Hem-1 depletion on phosphorylation of Akt/PKB (readout of PIP3 production) for cells stimulated with 100 nM fMLP. (D–F) Defects in PIP3 generation and Rac activation are independent of actin polymerization. Results are shown with standard error for cells stimulated in triplicate at 37 °C. (D) Cells were preincubated with 10 μM latrunculin B, stimulated with 10 nM fMLP for 30 s, and blotted with antibodies to PAK-phospho-Ser199. (E) Cells were preincubated with 10 μM latrunculin, stimulated with 1 nM fMLP for 15 s, lysed, and incubated with PAK-GBD (to capture Rac-GTP), and blotted for Rac. (F) Cells were preincubated with 10 μM latrunculin B, stimulated with 10 nM fMLP for 15 s, and then blotted with antibodies to Akt/PKB phospho-Thr308.
Figure 6
Figure 6. Hem-1 Knockdown Does Not Inhibit Reactive Oxygen Production in Response to Chemoattractant
The 6- to 7-day differentiated HL-60 cells were stimulated with the indicated concentration of fMLP or PMA, and reactive oxygen production was monitored in a luminometer. (Control unstimulated cells are superimposable with Hem-1 siRNA unstimulated cells.) Results are shown with standard error for cells stimulated in triplicate at 37 °C.
Figure 7
Figure 7. Chemotaxis, Stable Polarity, and the Spatial Regulation of Myosin Phosphorylation Are Dependent on Hem-1
(A) Equal numbers of differentiated control or Hem-1 knockdown cells were placed in the top of a Boyden chamber with the indicated concentration of chemoattractant in the bottom chamber. The y-axis indicates count of cells in bottom (chemoattractant) well at 3 h following stimulation. Results are shown with standard error for experiment performed in triplicate. (B,C) Time-lapse Nomarski images of control (B, Video S2) or Hem-1 knockdown (C, Video S3, Video S4) cells sandwiched between two coverslips and exposed to uniform 20 nM fMLP. Last frame shows outline of cells from first frame. Time in seconds from first frame (cells were prestimulated for 3 to 5 min prior to imaging). (D) Hem-1-knockdown cells fail to properly inhibit myosin light chain phosphorylation at the leading edge. Control or Hem-1 knockdown cells were stimulated with 20 nM fMLP for 3 min, fixed, and stained with fluorescent phalloidin to visualize filamentous actin or with antibodies to phosphorylated myosin light chain (phospho-Ser19). Representative staining for polarized cells is shown.
Figure 8
Figure 8. Role of Leading Edge Complexes in Cell Polarity
Migrating cells make different actin assemblies in the front and back. The leading and trailing edges of the cell are organized by different GTPases. Rac plays a role in two positive feedback circuits that organize the leading edge and drive stable protrusion (we call this nested feedback circuit Rac/actin/PIP3 positive feedback). A separate GTPase (Rho) organizes myosin-based contraction at the trailing edge, primarily through inactivation of myosin light chain phosphatase, leading to local phosphorylation and activation of myosin light chain. Several positive and negative feedback circuits are essential for the proper organization of cell polarity, but not all of the proteins involved in these circuits are known. In this paper, we discuss several leading edge protein complexes that play a role in organizing of the leading edge. These leading edge complexes link Rac with actin assembly (Activity 1) and play a role in a Rac positive feedback circuit (Activity 2), both essential elements of the positive feedback loop that organizes the leading edge. Leading edge complexes also potentially link Rac to the inhibition of Rho activity (Activity 3) and inhibition of myosin activation (Activity 4), both of which would act to exclude myosin phosphorylation from the leading edge. For simplicity, this model focuses on activities that are addressed in this paper and omits other possible links involved in Rac/actin/PIP3 positive feedback and from Rac to Rho and myosin.

Comment in

References

    1. Zigmond SH. Ability of polymorphonuclear leukocytes to orient in gradients of chemotactic factors. J Cell Biol. 1977;75:606–616. - PMC - PubMed
    1. Devreotes P, Janetopoulos C. Eukaryotic chemotaxis: Distinctions between directional sensing and polarization. J Biol Chem. 2003;278:20445–20448. - PubMed
    1. Wedlich-Soldner R, Wai SC, Schmidt T, Li R. Robust cell polarity is a dynamic state established by coupling transport and GTPase signaling. J Cell Biol. 2004;166:889–900. - PMC - PubMed
    1. Sasaki AT, Chun C, Takeda K, Firtel RA. Localized Ras signaling at the leading edge regulates PI3K, cell polarity, and directional cell movement. J Cell Biol. 2004;167:505–518. - PMC - PubMed
    1. Bourne HR, Weiner O. A chemical compass. Nature. 2002;419:21. - PubMed

Publication types

MeSH terms

Associated data