. 2006 Mar;3(3):e47.
doi: 10.1371/journal.pmed.0030047.

Gene expression programs in response to hypoxia: cell type specificity and prognostic significance in human cancers

Affiliations

Gene expression programs in response to hypoxia: cell type specificity and prognostic significance in human cancers

Jen-Tsan Chi et al. PLoS Med. 2006 Mar.

Abstract

Background: Inadequate oxygen (hypoxia) triggers a multifaceted cellular response that has important roles in normal physiology and in many human diseases. A transcription factor, hypoxia-inducible factor (HIF), plays a central role in the hypoxia response; its activity is regulated by the oxygen-dependent degradation of the HIF-1alpha protein. Despite the ubiquity and importance of hypoxia responses, little is known about the variation in the global transcriptional response to hypoxia among different cell types or how this variation might relate to tissue- and cell-specific diseases.

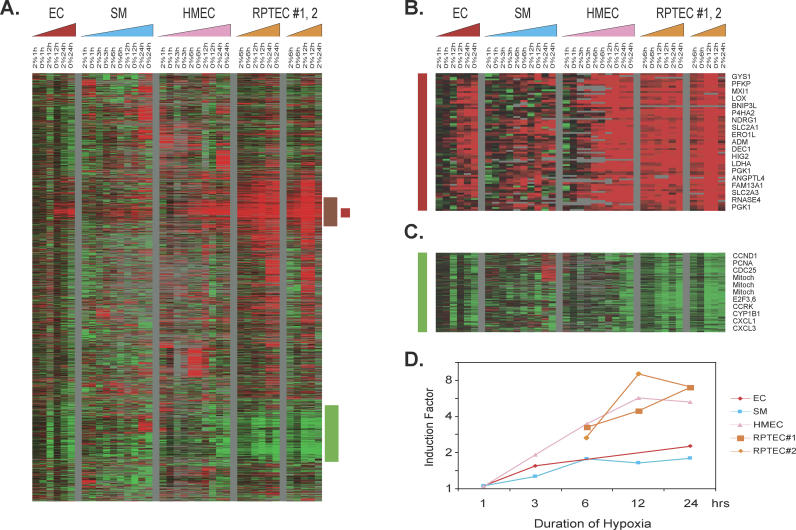
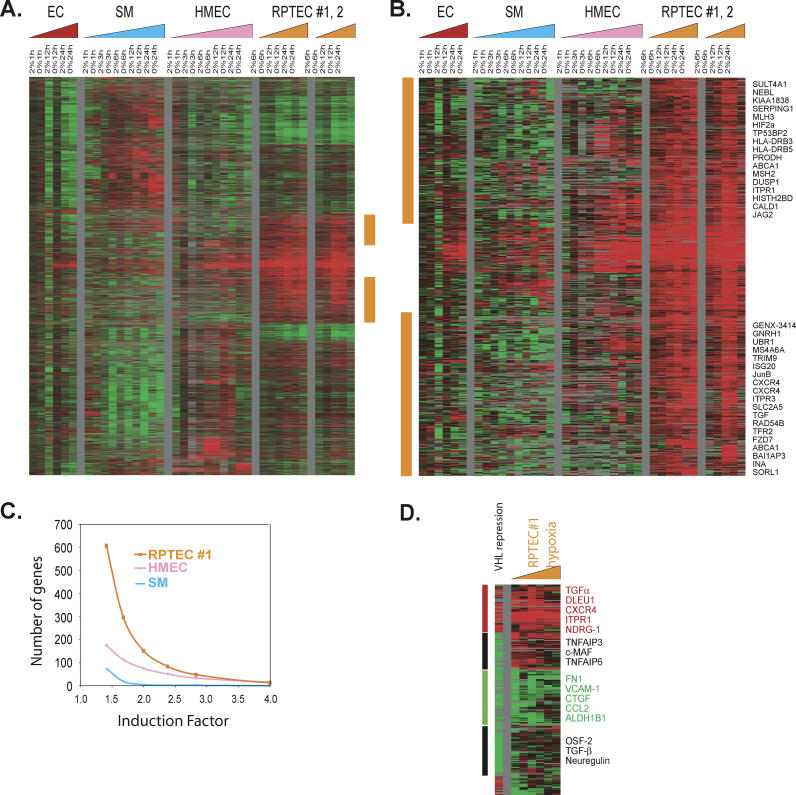
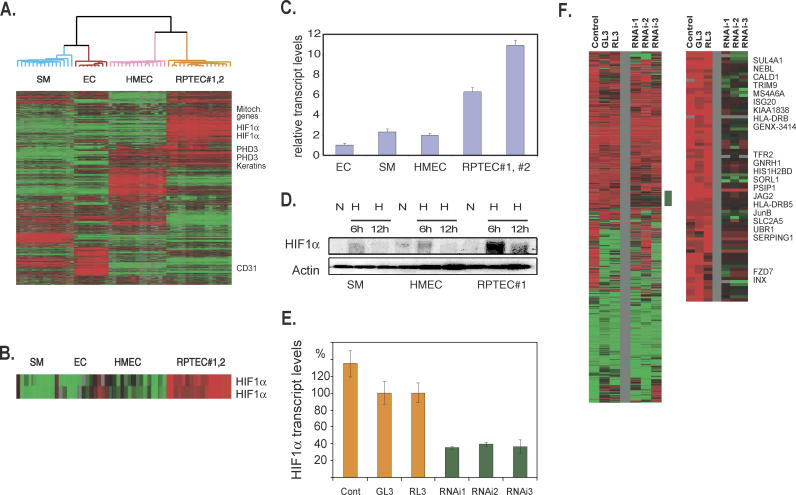
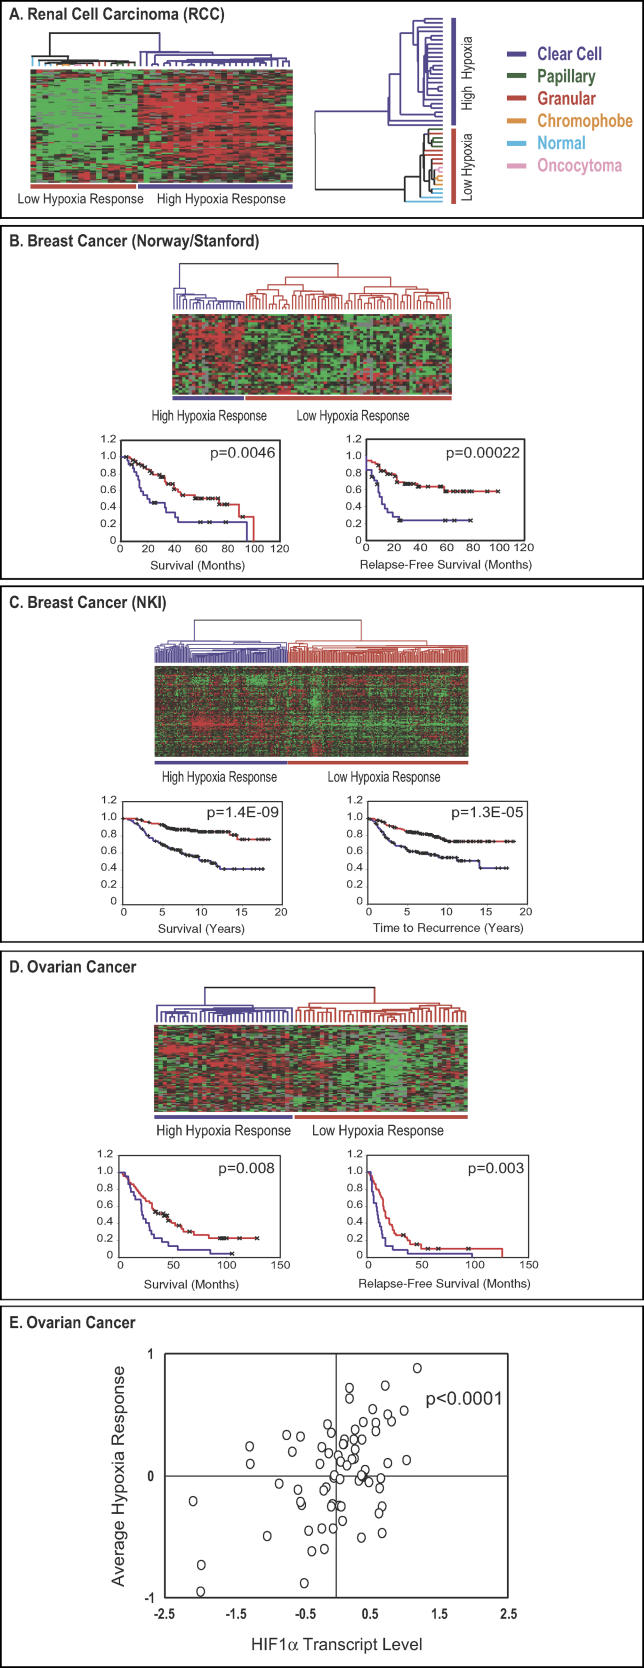
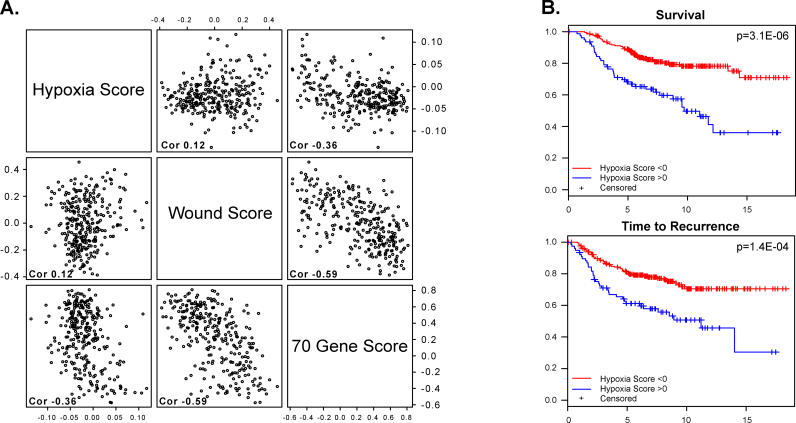
Methods and findings: We analyzed the temporal changes in global transcript levels in response to hypoxia in primary renal proximal tubule epithelial cells, breast epithelial cells, smooth muscle cells, and endothelial cells with DNA microarrays. The extent of the transcriptional response to hypoxia was greatest in the renal tubule cells. This heightened response was associated with a uniquely high level of HIF-1alpha RNA in renal cells, and it could be diminished by reducing HIF-1alpha expression via RNA interference. A gene-expression signature of the hypoxia response, derived from our studies of cultured mammary and renal tubular epithelial cells, showed coordinated variation in several human cancers, and was a strong predictor of clinical outcomes in breast and ovarian cancers. In an analysis of a large, published gene-expression dataset from breast cancers, we found that the prognostic information in the hypoxia signature was virtually independent of that provided by the previously reported wound signature and more predictive of outcomes than any of the clinical parameters in current use.

Conclusions: The transcriptional response to hypoxia varies among human cells. Some of this variation is traceable to variation in expression of the HIF1A gene. A gene-expression signature of the cellular response to hypoxia is associated with a significantly poorer prognosis in breast and ovarian cancer.


Conflict of interest statement

Competing Interests: POB is Co-Founder of the Public Library of Science and is on its Board of Directors.

Figures

Figure 1
Figure 1. Overview of the Genomic Responses to Hypoxia
(A–C) Hierarchical clustering of a total of 4,333 elements that display a greater than 3-fold change in mRNA expression in more than four different samples when exposed to hypoxia (A). Data from individual elements or genes are represented as single rows, and different time points in the time courses (triangles) are shown as columns. Red and green denote expression levels of samples cultured under hypoxia (2% O2) or anoxia (0% O2) greater or lower, respectively, than baseline values of samples cultured under ambient air (∼21% O2). The intensity of the color reflects the magnitude of the change from baseline. The color of the triangles represents the time course of the different cell types (red, ECs; blue, SMCs; pink, HMECs; orange, RPTECs). The vertical red bar marks a cluster of genes induced in all cells, termed the “common hypoxia genes” (B); the vertical brown bar marks a cluster of genes induced in all epithelial cells, termed the “epithelial hypoxia genes”; and the vertical green bar marks a cluster of genes repressed in all cells, termed the “commonly repressed hypoxia genes” (C). The gene clusters representing “common hypoxia genes” (B) and the “commonly repressed hypoxia genes” (C) are expanded to show the names of representative genes on the right side. (D) Average folds of gene induction (y-axis) in the common hypoxia genes cluster from each indicated cell type at different time points (x-axis) are calculated and shown. (Complete data can be found at: http://microarray-pubs.stanford.edu/hypoxia)
Figure 2
Figure 2. Cell Type–Specific Hypoxia Response
(A and B) Hierarchical clustering of a total of 5,432 array elements showing a cell type-specific hypoxia response that are selected by multiclass SAM using zero-transformed gene expression with a FDR of 3.7% (A). The orange vertical bar marks clusters of genes induced only in RPTECs and is expanded with the names of representative genes (B). (C) The number of genes (y-axis) with fold inductions greater than those indicated (x-axis) in all six hypoxic samples (6, 12, and 24 h at 2% and 0% O2) are shown for SMCs (SM, blue curve), HMECs (pink curve), and RPTEC#1 (orange curve). (D) Comparison of the gene expression pattern of VHL-reconstituted RCCs (A498 cells) to the hypoxia response of RPTEC#1. We compared the expression of genes affected by VHL reconstitution of VHL-deficient RCC A498 cells (from [38] and in the sample marked “VHL repression”) to the expression of those same genes in RPTEC#1 with hypoxia treatments (samples marked “RPTEC#1 hypoxia”). Genes showing concurrent induction (vertical red bar), concurrent repression (vertical green bar), and VHL-specific response (vertical black bar) are shown with selected gene names. (Complete data can be found at: http://microarray-pubs.stanford.edu/hypoxia)
Figure 3
Figure 3. Elevated HIF-1α in RPTECs and Its Role in RPTEC Hypoxia Response
(A and B) Hierarchical clustering of a total of 3,630 arrays elements that display a greater than 3-fold change in mRNA expression when placed under hypoxic/anoxic environments in more than four different samples among the 56 samples (A). All samples of the same cell lineages segregate themselves into distinct branches (EC, red; HMEC, pink; RPTEC#1 and #2, orange; SM, blue). The names of some representative genes (mitochondrial genes, PHD3, CD31, and genes encoding keratins) are shown to the right, and two elements representing HIF-1α are expanded in (B). (C) The relative expression level of HIF-1α assessed with real-time PCR is shown for different cell types under ambient O2 concentration. (D) The levels of HIF-1α protein measured by Western blots of different cells under either ambient air (N) or 2% O2 (H) at the indicated times (6 or 12 h). (E) The level of HIF-1α in RPTECs assessed with real-time PCR after the transfection of either control d-siRNAs (transfection fluid alone [Cont] or Dicer-generated siRNAs generated from GL3 or RL3) or d-siRNAs generated from different regions of HIF-1α mRNAs (RNAi-1, 2, and 3). (F) The comparison of hypoxia responses of RPTECs after treatment with either three control or three HIF-1α RNAi transfections. A cluster of genes sensitive to HIF-1α RNAi treatments is marked by a vertical green bar and is expanded with the names of selected genes shown. All the genes with names shown are induced only in RPTECs during hypoxia (Figure 2B). (Complete data can be found at: http://microarray-pubs.stanford.edu/hypoxia)
Figure 4
Figure 4. The Analysis of Hypoxia Response in Human Cancers
The expression values of genes in the “epithelial cell hypoxia signature” were extracted from an expression study of 41 renal tumors (A) [28]. Genes and samples are organized by hierarchical clustering. The tumors are segregated into two groups defined by high (blue) or low (red) hypoxia response. The histopathological features of renal tumors within the high and low hypoxia response groups are shown. Expression patterns of available “epithelial hypoxia response” genes in a group of breast cancer samples from Norway and Stanford (B) [29] and NKI (C) [47] as well as ovarian cancer samples (D) are shown. The tumors are separated into two groups based on their hypoxia responses, high or low. Kaplan-Meier curves for the clinical outcomes of indicated tumors exhibiting high and low hypoxia responses are shown in (B), (C), and (D). In the Kaplan-Meier curve diagrams, high hypoxia response is indicated by blue, low hypoxia response is indicated by red, and censored patients are indicated with “x” marks. The correlation between the average hypoxia response and HIF-1α RNA levels in 70 ovarian cancer samples is shown in (E).
Figure 5
Figure 5. Quantitative Analyses of the Prognostic Significance of the Hypoxia Response Signature
Response signature was analyzed in the 295 breast cancer samples in the NKI study (A) Scatter plots showing the relationship between the value of the average expression level of the genes in the hypoxia signature and that of genes in the wound response signature [22] or 70-gene signature [48]. Each point in the scatter plots represents a single one of the 295 tumors analyzed in the NKI dataset. The overall correlation between each pair of expression signatures across this set of 295 samples is indicated in each panel. (B) With the threshold value of the hypoxia response signature for classification of patients into high and low hypoxia response groups set at zero, the Kaplan-Meier curve shows significant differences in survival and time to recurrence between the samples in the high and low hypoxia response groups of these breast cancer samples.

Comment in

References

    1. Giaccia AJ, Simon MC, Johnson R. The biology of hypoxia: The role of oxygen sensing in development, normal function, and disease. Genes Dev. 2004;18:2183–2194. - PMC - PubMed
    1. Hewitson KS, Schofield CJ. The HIF pathway as a therapeutic target. Drug Discov Today. 2004;9:704–711. - PubMed
    1. Motzer RJ, Bander NH, Nanus DM. Renal-cell carcinoma. N Engl J Med. 1996;335:865–875. - PubMed
    1. Blagosklonny MV, An WG, Romanova LY, Trepel J, Fojo T, et al. p53 inhibits hypoxia-inducible factor-stimulated transcription. J Biol Chem. 1998;273:11995–11998. - PubMed
    1. Zundel W, Schindler C, Haas-Kogan D, Koong A, Kaper F, et al. Loss of PTEN facilitates HIF-1-mediated gene expression. Genes Dev. 2000;14:391–396. - PMC - PubMed

Publication types

Substances