. 2006 May 1;107(9):3716-23.
doi: 10.1182/blood-2005-03-0897. Epub 2006 Jan 17.

Gene expression and angiotropism in primary CNS lymphoma

Affiliations

Gene expression and angiotropism in primary CNS lymphoma

James L Rubenstein et al. Blood. .

Abstract

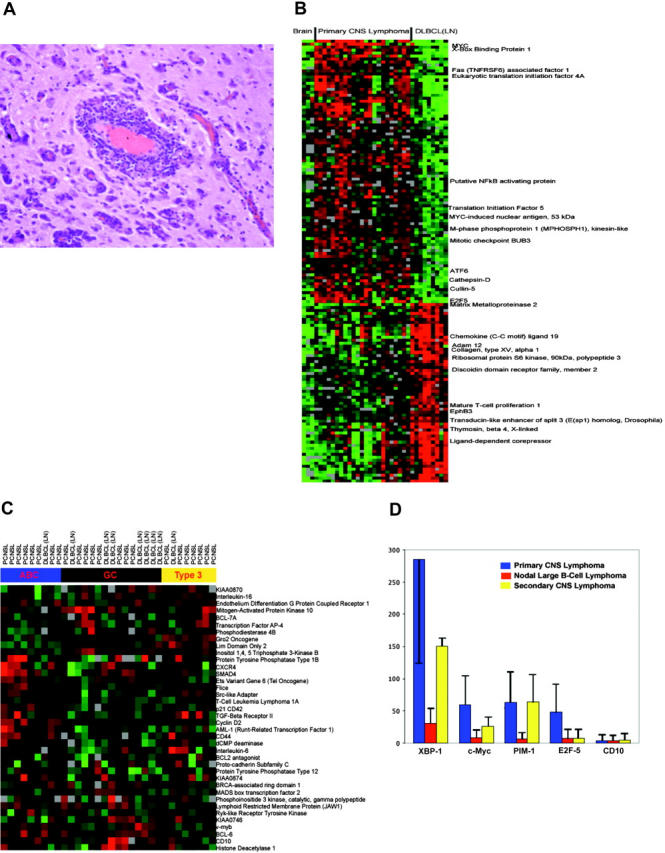
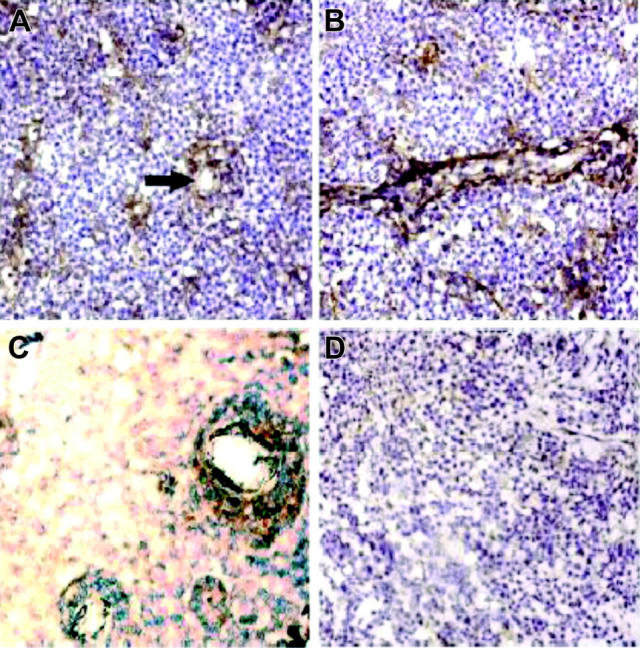
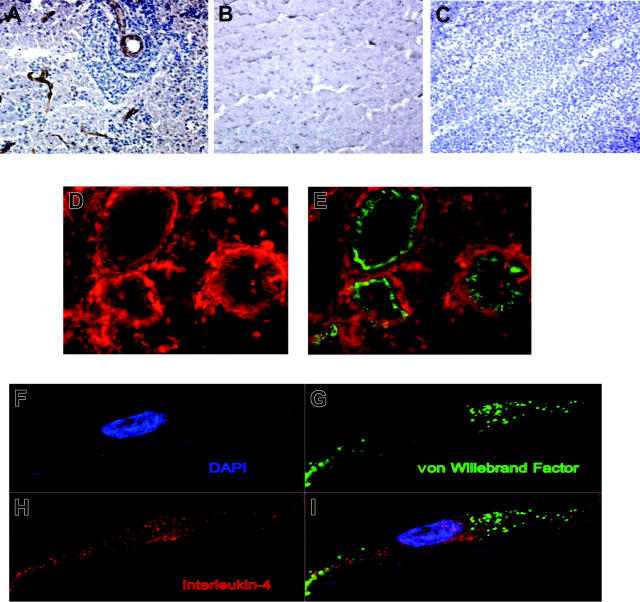
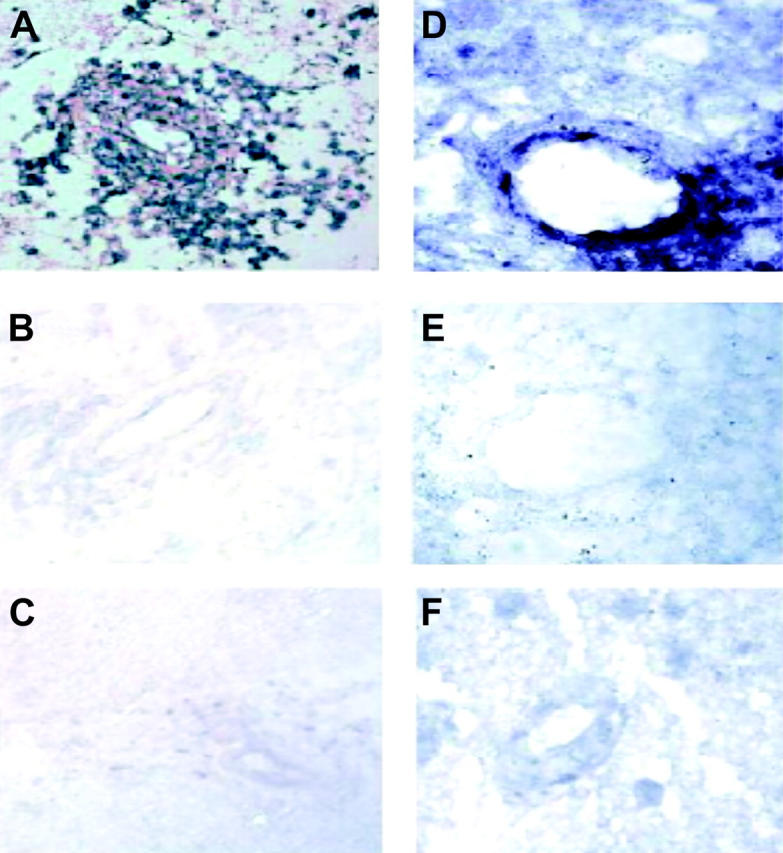
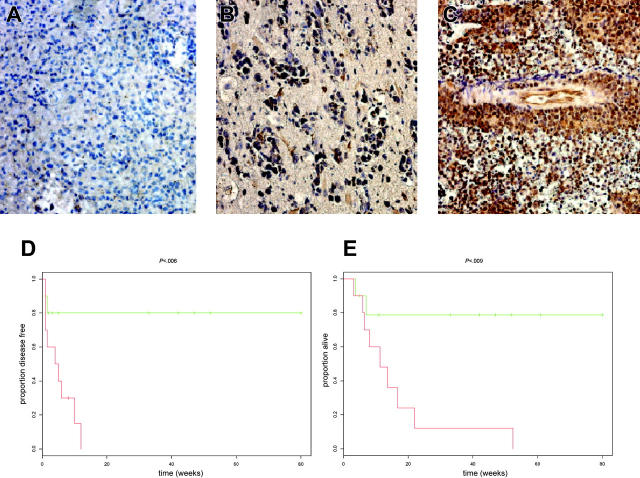
Primary CNS lymphoma is an aggressive form of non-Hodgkin lymphoma whose growth is restricted to the central nervous system. We used cDNA microarray analysis to compare the gene expression signature of primary CNS lymphomas with nodal large B-cell lymphomas. Here, we show that while individual cases of primary CNS lymphomas may be classified as germinal center B-cell, activated B-cell, or type 3 large B-cell lymphoma, brain lymphomas are distinguished from nodal large B-cell lymphomas by high expression of regulators of the unfolded protein response (UPR) signaling pathway, by the oncogenes c-Myc and Pim-1, and by distinct regulators of apoptosis. We demonstrate that interleukin-4 (IL-4) is expressed by tumor vasculature as well as by tumor cells in CNS lymphomas. We also identify high expression in CNS lymphomas of several IL-4-induced genes, including X-box binding protein 1 (XBP-1), a regulator of the UPR. In addition, we demonstrate expression of the activated form of STAT6, a mediator of IL-4 signaling, by tumor cells and tumor endothelia in CNS lymphomas. High expression of activated STAT6 in tumors was associated with short survival in an independent set of patients with primary CNS lymphoma who were treated with high-dose intravenous methotrexate therapy.


Figures

Figure 1.
Figure 1.
Angiotropism and gene expression in primary CNS lymphoma. (A) Angiotropic growth pattern in primary CNS lymphoma. Hematoxylin and eosin stain were used. Specimens used for gene expression analysis in this study were more highly cellular, consisting of at least 70% tumor cells. (B) Distinctions in gene expression between CNS lymphoma and nodal large B-cell lymphoma. Transcriptional profiles of 23 specimens of primary CNS lymphomas were compared with 3 specimens of nonneoplastic brain and with 9 consecutive specimens of large B-cell lymphoma obtained from lymph nodes. Only genes differentially expressed with a false discovery rate less than 0.01 are shown. The samples are clustered within molecular subtypes and ordered by the subtype. The image reveals distinct patterns of gene expression between CNS lymphomas and nodal lymphomas. Each column represents an individual tumor, and each row represents a single gene. Red indicates up-regulation; green, down-regulation; and black, similar to the median of the reference pool. (C) Assignment of PCNSL and nodal DLBCL tumors to germinal center (GCB), activated B cell (ABC), and type 3 subclasses. PCNSL tumors were distributed equally among the 3 subclasses. Hierarchic clustering was based upon the expression of 38 established marker genes of ABC and GCB subtypes. (D) Mean expression of 4 marker genes distinguishes CNS lymphoma as determined by quantitative real-time PCR in cases of primary CNS lymphomas (blue), large B-cell lymphomas from lymph nodes (red), and secondary CNS lymphomas (metastatic CNS lymphomas; yellow). Y-axis corresponds to percent expression of control gene. Error bars depict standard deviation of mean value. P values refer to the differences in expression between primary CNS lymphomas and nodal large B-cell lymphoma: XBP-1 (P < .001), c-Myc (P < .001), PIM-1 (P < .001), and E2F-5 (P < .001). CD10 expression was similar in the 3 types of lymphomas. Gene expression values obtained by microarray analysis were in agreement with those obtained by quantitative RT-PCR. (The minimum Pearson correlation is 0.65 corresponding to the P value of < .001 for the test of the hypothesis of no association between microarray and Taqman data for these marker genes.)
Figure 2.
Figure 2.
XBP-1 expression. Immunohistochemical localization of XBP-1 expression (brown color) in tumor cells surrounding the CNS tumor vasculature in a hematoxylin-stained tumor. (A) Transverse view; arrow points to a blood vessel. (B) Longitudinal view of vessel; XBP-1 immunoreactivity of tumor cells distinguishes them from endothelial cells. (C) Intense XBP-1 immunoreactivity exhibited by a dense population of tumor cells growing around a tumor vessel at the infiltrating edge of a different CNS lymphoma tumor specimen. (D) There was minimal XBP-1 immunoreactivity in a representative specimen of large B-cell lymphoma isolated from a lymph node. When assessed by immunohistochemistry, the pattern of BCL-6 expression was diffuse within CNS lymphomas, not differentially related to the tumor vasculature (not shown). Original magnification × 200 for all panels.
Figure 3.
Figure 3.
IL-4 expression in primary CNS lymphoma. (A) Immunohistochemical localization of IL-4 (brown color) to vessels associated with angiotropic CNS lymphoma cells at the infiltrating edge of a primary CNS lymphoma. (B) IL-4 immunoreactivity was not detected in the vessels of normal brain. (C) IL-4 immunoreactivity was absent or less prominent in association with the vessels of large B-cell lymphoma isolated from lymph nodes. Original magnification × 200 for panels A-C. (D-E) Dual-color immunofluorescence demonstrates colocalization of IL-4 (D-E; Alexa 594 red immunofluorescence) and von Willebrand factor (E; FITC immunofluorescence) on tumor vessels in primary CNS lymphomas. Original magnification × 400 for panels D-E. (F-I) Endothelial cells in CNS lymphoma are immunoreactive for IL-4 as demonstrated by confocal microscopy. Diffuse cytoplasmic and perinuclear IL-4 expression by an endothelial cell did not exhibit significant spectral overlap with von Willebrand factor expression, which appeared to be localized to specialized Weibel-Palade bodies. Dimensions of displayed images are 68.3 μm × 31.8 μm each.
Figure 4.
Figure 4.
IL-4 in situ hybridization. (A) In situ hybridization with an antisense riboprobe against IL-4 demonstrates gene expression by CNS lymphoma cells. (B) There was no significant hybridization with a sense riboprobe against IL-4 in a parallel section from the same tumor. (C) Tumor cells and vessels in a breast carcinoma metastatic to brain did not exhibit significant hybridization with an antisense riboprobe against IL-4. Original magnification × 200 for panels A-C. (D) In situ hybridization with an antisense riboprobe against IL-4 reveals increased gene expression in a representative CNS lymphoma tumor vessel. (E) There was no significant hybridization with a sense riboprobe against IL-4 in a parallel section from the same tumor. (F) Vessels in normal brain did not exhibit significant hybridization with an antisense riboprobe against IL-4. Original magnification × 400 for panels D-F.
Figure 5.
Figure 5.
Three common patterns of P-STAT6 expression in PCNSL. (A) Low cellular density; absent P-STAT6 expression. (B) Low cellular density; positive P-STAT6 expression. (C) High cellular density; strong P-STAT6 nuclear expression both by tumor cells and on vascular endothelia. Patients whose tumors exhibited foci of high cellular density with positive P-STAT6 expression (C) had significantly worse outcomes than patients with tumors that were negative for P-STAT6 or tumors that were of low cellular density that scored positive for P-STAT6. Original magnification × 200 for panels A-C. Patients with intense P-STAT6 expression (C; red) experienced early progression (D) and short overall survival (E) when treated initially with high-dose methotrexate-based regimens. Green refers to tumors with sparse or absent P-STAT6 expression. (Whole-brain radiation was reserved for patients with methotrexate-refractory disease.) (Ten patients in each group; P values were calculated by log-rank test.)

References

    1. Abrey LE, DeAngelis LM, Yahalom J. Long-term survival in primary CNS lymphoma. J Clin Oncol. 1998;16: 859-863. - PubMed
    1. Fine HA, Mayer RJ. Primary central nervous system lymphoma. Ann Intern Med. 1993;119: 1093-1104. - PubMed
    1. Bokstein F, Lossos A, Lossos IS, Siegal T. Central nervous system relapse of systemic non-Hodgkin's lymphoma: results of treatment based on high-dose methotrexate combination chemotherapy. Leuk Lymphoma. 2002;43: 587-593. - PubMed
    1. Alizadeh AA, Eisen MB, Davis RE, et al. Distinct types of diffuse large B-cell lymphoma identified by gene expression profiling. Nature. 2000;403: 503-511. - PubMed
    1. Rosenwald A, Wright G, Chan WC, et al. Lymphoma/Leukemia Molecular Profiling Project: the use of molecular profiling to predict survival after chemotherapy for diffuse large-B-cell lymphoma. N Engl J Med. 2002;346: 1937-1947. - PubMed

Publication types

MeSH terms