Comparative Study
. 2006 Jan;27(1):85-93.

Perfusion imaging of meningioma by using continuous arterial spin-labeling: comparison with dynamic susceptibility-weighted contrast-enhanced MR images and histopathologic features

Affiliations
Comparative Study

Perfusion imaging of meningioma by using continuous arterial spin-labeling: comparison with dynamic susceptibility-weighted contrast-enhanced MR images and histopathologic features

H Kimura et al. AJNR Am J Neuroradiol. 2006 Jan.

Abstract

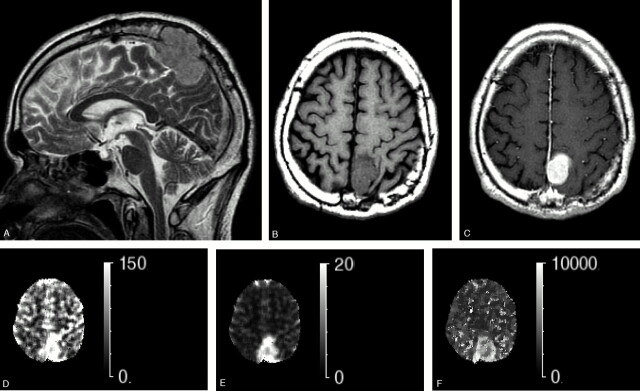
Purpose: The goal of the present study was to determine the utility of continuous arterial spin labeling (CASL) for characterization of meningioma by MR perfusion imaging and to compare these results with those obtained from the T2 dynamic susceptibility contrast (T2DSC) method and from histopathologic examination.

Methods: Twenty-one cases of meningiomas were examined at 1.5T. CASL perfusion imaging was implemented on the basis of multisection single-shot echo-planar imaging with velocity-driven adiabatic spin-inversion preparation. T2DSC perfusion imaging was also performed by using a double-echo spoiled gradient echo sequence in a section containing the tumor. By focusing on the regions of interest, maps of % signal intensity change and cerebral blood flow (CBF) were determined from CASL and cerebral blood volume (CBV). CBF and mean transit time (MTT) were obtained from T2DSC. The microvessel area (MVA) was determined from specimens immunostained with anti-CD31 in 14 cases by measuring the total amount of staining in each histologic section. Linear regression analysis was performed for rCBF values from both perfusion methods and for % signal intensity change and MVA.

Results: There was a significant correlation between CBF values determined from both perfusion methods (r(2) = 0.73; P < .001); however, the slope from T2DSC to CASL was less than unity, likely because of the different vascular weighting used for each method. There was also a significant correlation between CASL-% signal intensity change and MVA determined by histopathology (r(2) = 0.91; P < .00001). Perfusion values were the greatest for angiomatous meningioma and lowest for fibrous meningioma when using either perfusion method.

Conclusions: CASL and T2DSC perfusion methods are comparable in the characterization of meningiomas. Further, CASL is of use in assessing tumor microcirculation.


Figures

Fig 1.
Fig 1.
Multisection images obtained in a 60-year-old patient with meningioma (patient 8). Echo-planar images (4100/20 milliseconds), perfusion-weighted images, T1 maps, and quantitative CASL-rCBF maps are shown from the top to bottom rows. Values in rightmost column were expressed as milliseconds and mL/min/100 g in T1 maps and rCBF maps, respectively. The left parietal parasagittal meningioma is revealed as hyperperfusion in perfusion-weighted images and rCBF maps.
Fig 2.
Fig 2.
Conventional T2-weighted images and axial T1 images with and without Gd-DTPA. The perfusion maps obtained with T2DSC in a 60-year-old patient with parietal falx meningioma (patient 8, same as Fig 1). A, Sagittal T2-weighted image. B, T1-weighted image. C, Post-Gd-DTPA T1-weighted image. D, T2DSC perfusion image (rCBF map). E, T2DSC perfusion image (rCBV map. F, T2DSC perfusion image (MTT map). The tumor shows higher signal intensity than the cortex as well as enhancement on T2-weighted and post-Gd T1-weighted images. Dural tail sign is apparent in the anterior aspect of tumors. Note that the tumor protrudes into bone through the dura matter and cortical layers. The hyperperfusion signals are apparent on perfusion maps obtained with T2DSC, rCBF, and rCBV. Note that the MTT of tumor region has a slightly longer transit time relative to the parenchyma region.
Fig 3.
Fig 3.
Axial conventional images and perfusion maps obtained with CASL and T2DSC in a 78-year-old patient with frontal convex meningioma (patient 7). A, T2-weighted image. B, T1-weighted image. C, Post-Gd T1-weighted image. D, CASL perfusion-weighted image (rCBF map). E, T2DSC perfusion image (rCBF map), The tumor shows a very high signal intensity and intense enhancement on T2-weighted and post-Gd T1-weighted images, respectively. The hyperperfusion signal intensity is apparent on perfusion maps obtained with CASL and T2DSC. F, HE-stained sections (×200) from the same case. The angiomatous subtype of meningioma was confirmed on histologic examination. The large thin-walled vessels in which red blood cells are contained are found throughout the specimen.
Fig 4.
Fig 4.
Axial conventional images and perfusion maps obtained with CASL and T2DSC in a 49-year-old patient with frontal falx meningioma (patient 6). A, T2-weighted image. B, T1-weighted image. C, Post-Gd T1-weighted image. D, CASL perfusion-weighted image (rCBF map). E, T2DSC perfusion image (rCBF map). The tumor shows slightly higher signal intensity than the cortex as well as good enhancement on T2-weighted and post-Gd T1-weighted-images, respectively. Note that the posterior aspect of tumor revealed very low signal intensity on T2-weighted images, corresponding to hemorrhagic change, which was also confirmed by CT imaging during the same period. The hyperperfusion signal intensity is apparent on perfusion maps obtained with CASL and T2DSC. F, HE-stained sections (×100) from the same case. The fibrous subtype of meningioma was confirmed on histologic examination. Microvessels are very scantly scattered in the specimen.
Fig 5.
Fig 5.
Tumor blood flow in each histologic group. The plot shows absolute tumor blood flow determined by continuous arterial spin-labeling in 10 patients with histologically proved meningiomas in each histologic subtype group. Three atypical and one clear cell subtype was excluded. Error bars indicate standard deviation. The result of Tukey-Kramer Multiple Comparisons Test is shown as ns (not significant: P > .05) and ** (significant difference: P < .01).
Fig 6.
Fig 6.
Scatter plots of tumor blood flow between T2DSC and CASL. A, CASL-rCBF versus T2DSC-rCBF. B, Ratio of tumor blood flow relative to whole section values between T2DSC and CASL. Linear regression analyses reveal high correlation in absolute rCBF values and relative ratios. The equation of the regression line is drawn in panels A and B. r2 is the square value of correlation coefficient. Dashed lines indicate 95% confidence bands for the linear regression.
Fig 7.
Fig 7.
A, Microvessel immunostaining by using CD31 in meningioma (patient 6, same case as in Figs 1 and 2). The microvessel walls are positively stained. B, The microvessel areas are extracted automatically by the software. Note that the light green areas are overlaid on the immunostained specimen to the areas recognized as the lumen of microvessel structures.
Fig 8.
Fig 8.
Microvessel area on histologic specimens (MVA) versus signal intensity change from CASL perfusion images in all 14 patients with meningioma. Linear regression analyses revealed high correlation, with an r2 of 0.9127; 95% confidence bands are indicated by dashed lines. Regressed linear equation is shown as an inset in the graph.

References

    1. Ostergaard L, Weisskoff RM, Chesler DA, et al. High resolution measurement of cerebral blood flow using intravascular tracer bolus passages. Part I. Mathematical approach and statistical analysis. Magn Reson Med 1996;36:715–25 - PubMed
    1. Ostergaard L, Sorensen AG, Kwong KK, et al. High resolution measurement of cerebral blood flow using intravascular tracer bolus passages. Part II. Experimental comparison and preliminary results. Magn Reson Med 1996;36:726–36 - PubMed
    1. Aronen HJ, Cohen MS, Belliveau JW, et al. Ultrafast imaging of brain tumors. Top Magn Reson Imaging 1993;5:14–24 - PubMed
    1. Aronen HJ, Gazit IE, Louis DN, et al. Cerebral blood volume maps of gliomas: comparison with tumor grade and histologic findings. Radiology 1994;191:41–51 - PubMed
    1. Knopp EA, Cha S, Johnson G, et al. Glial neoplasms: dynamic contrast-enhanced T2*-weighted MR imaging. Radiology 1999;211:791–98 - PubMed

Publication types

MeSH terms

LinkOut - more resources