. 2006 Jan 16;172(2):177-87.
doi: 10.1083/jcb.200507073.

Coregulated human globin genes are frequently in spatial proximity when active

Affiliations

Coregulated human globin genes are frequently in spatial proximity when active

Jill M Brown et al. J Cell Biol. .

Abstract

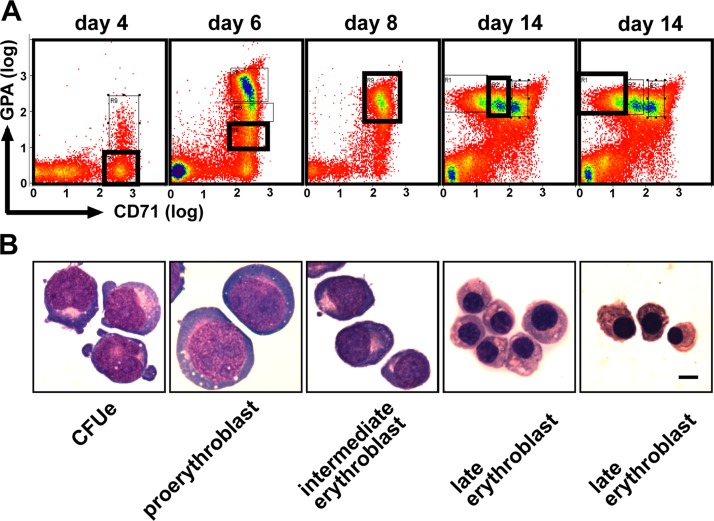
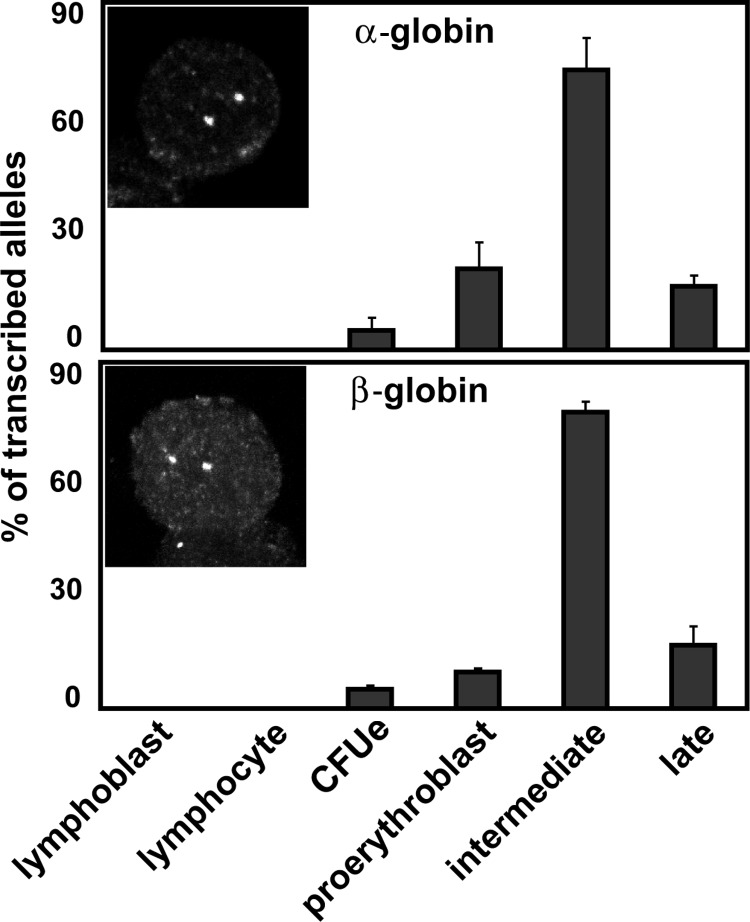
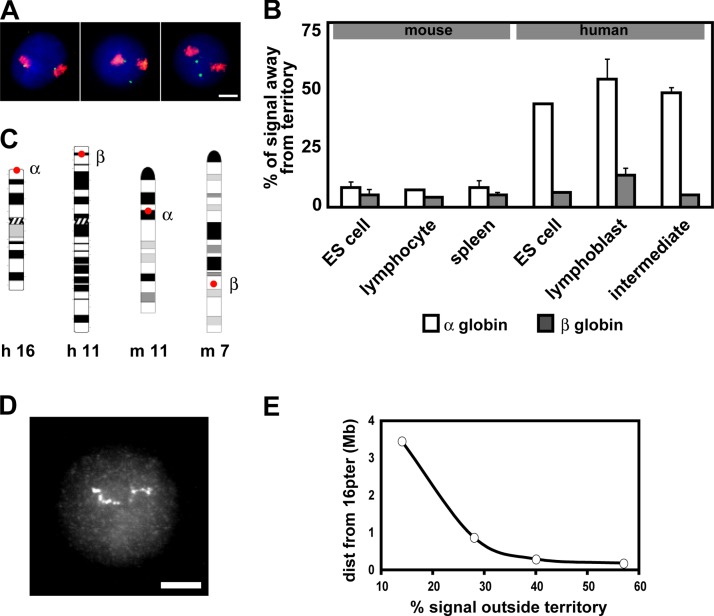
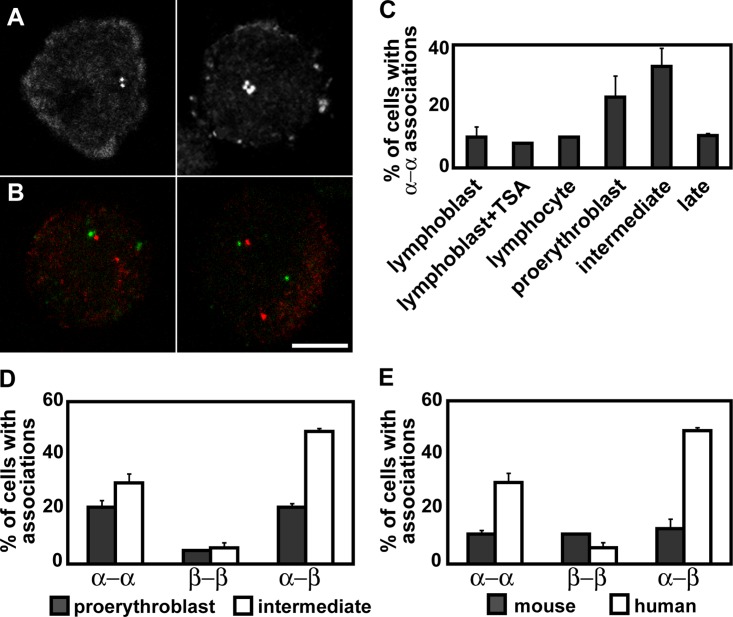
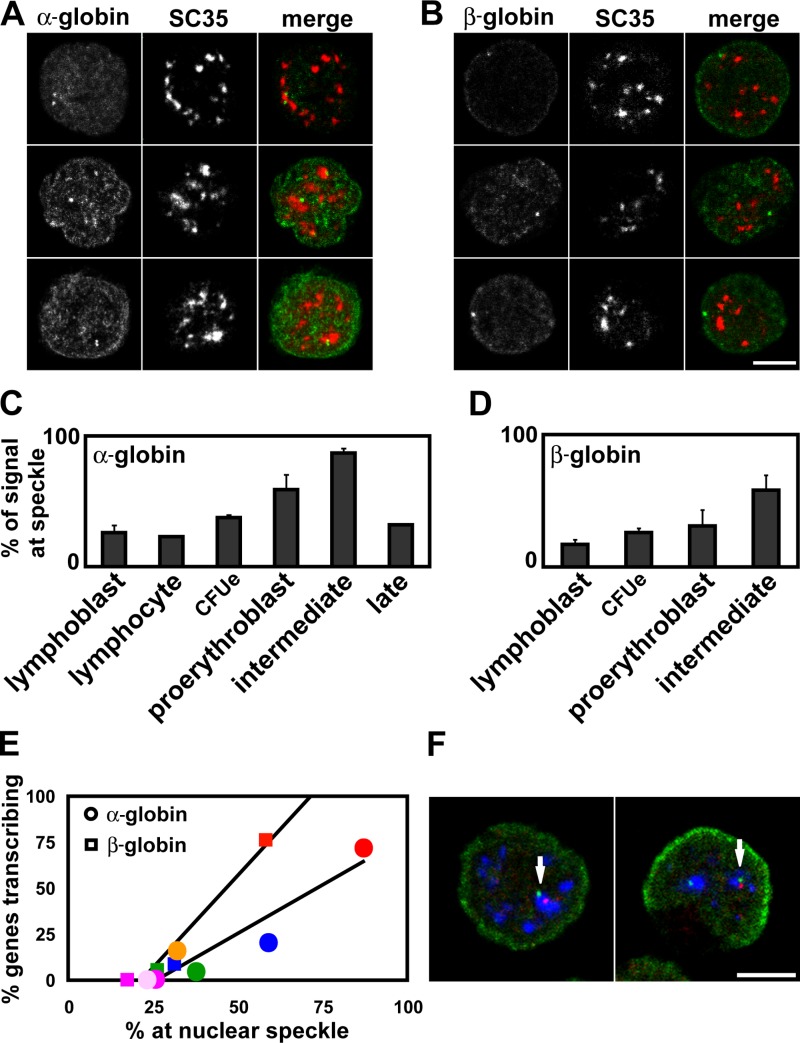
The organization of genes within the nucleus may influence transcription. We have analyzed the nuclear positioning of the coordinately regulated alpha- and beta-globin genes and show that the gene-dense chromatin surrounding the human alpha-globin genes is frequently decondensed, independent of transcription. Against this background, we show the frequent juxtaposition of active alpha- and beta-globin genes and of homologous alpha-globin loci that occurs at nuclear speckles and correlates with transcription. However, we did not see increased colocalization of signals, which would be expected with direct physical interaction. The same degree of proximity does not occur between human beta-globin genes or between murine globin genes, which are more constrained to their chromosome territories. Our findings suggest that the distribution of globin genes within erythroblast nuclei is the result of a self-organizing process, involving transcriptional status, diffusional ability of chromatin, and physical interactions with nuclear proteins, rather than a directed form of higher-order control.


Figures

Figure 1.
Figure 1.
Cell sorting for human primary erythroblasts at defined stages of differentiation. (A) Flow sorting profiles of erythroblast cultures at successive days after the addition of erythropoietin, as indicated. Cells were sorted based on GPA and CD71 staining from the bold black rectangular gate in each profile. (B) Representative MGG-stained cells from each gated fraction. Bar, 5 μm.
Figure 2.
Figure 2.
Maximal expression of globin genes occurs in intermediate erythroblasts. Globin gene transcription in nonerythroid cells and sorted successive stages of differentiating erythroblasts. Error bars represent one standard deviation, calculated from two to five hybridizations. Representative nuclei show RNA FISH detection of nascent transcripts from the α- and β-globin genes.
Figure 3.
Figure 3.
Human α-globin genes extend out of the chromosome territory irrespective of transcriptional status. (A and B) DNA FISH signals for α- and β-globin genes were scored for position in relation to their chromosome territory, delineated by whole chromosome FISH paint in erythroid and nonerythroid cell types. (A) Three representative lymphoblast nuclei are depicted with both α-globin gene signals sitting at or in the HSA16 territory, one sitting at and one located away from the territory, and both located away from their territories, respectively. Bar,5 μm. (B) The percentage of α-globin (white bars) and β-globin (gray bars) gene FISH signals located away from their chromosome territory in different mouse and human cell types. Error bars represent one standard deviation, calculated from two to five hybridizations. (C) Ideograms of HSA16, HSA11, MMU11, and MMU7, showing the locations of the α- and β-globin genes. (D) DNA FISH signals for a pool of 24 cosmids, from a 2-Mb contig within 16p13.3, which was hybridized to a lymphoblast nucleus. The contig can be seen extending across half the diameter of the nucleus. Bar, 5 μm. (E) Positioning of DNA FISH signals for four cosmids from 16p13.3, in respect to HSA16 territory. Cosmids are respectively centered within the linear genome at 3.5 Mb and 874, 292, and 181 kb away from the HSA16 short-arm telomere.
Figure 4.
Figure 4.
Interphase association of α- and β-globin genes in primary intermediate erythroblast nuclei. (A) DNA FISH showing association of homologous α-globin genes. (right) Replicated genes. (B) RNA FISH showing α-globin (red) and β-globin (green) gene transcripts associating. Bar, 5 μm. (C) Proportion of cells where the homologous α-globin DNA FISH signals are associating in human lymphoid and erythroid cell types. Lymphoblasts were untreated or treated with TSA. (D) Proportion of cells with RNA FISH signals for all four globin gene transcripts, where the homologous α-globin signals, homologous β-globin signals, or α- and β-globin signals are associating, in human proerythroblast and intermediate erythroblast nuclei. (E) Proportion of cells with RNA FISH signals as in D, in mouse and human intermediate erythroblast nuclei. Error bars represent one standard deviation, calculated from two to fourteen hybridizations.
Figure 5.
Figure 5.
Location of α- and β-globin genes in respect to SC35-enriched nuclear speckles. (A) Representative intermediate erythroblast nuclei for immuno-FISH detection of α-globin genes with SC35 protein. Both α-globin signals contacting the same speckle (top), the α-globin signals contacting different speckles (middle), and one replicated α-globin signal at a speckle (bottom). (B) Representative intermediate erythroblast nuclei for immuno-FISH detection of β-globin genes with SC35 protein. (top) One β-globin signal contacting a small speckle in the outer shell of the nucleus; (middle and bottom) the β-globin signals sitting away from any speckles. Bar, 5 μm. (C and D) Proportion of α-globin (C) and β-globin (D) FISH signals contacting a nuclear speckle in different cell types. Error bars represent one standard deviation, calculated from two to three hybridizations. (E) Proportion of globin genes transcribing (Fig. 2) plotted against their location at nuclear speckles. α-globin (circles) and β-globin (squares) FISH signals were scored in lymphoblasts (pink), lymphocytes (pale pink), CFUes (green), proerythroblasts (blue), intermediate eryth-roblasts (red), and late erythroblasts (orange). (F) Immuno-FISH showing α-globin (red) and β-globin (green) genes associating at the same nuclear speckle (arrow). Bar, 5 μm.

References

    1. Anguita, E., J. Hughes, C. Heyworth, G.A. Blobel, W.G. Wood, and D.R. Higgs. 2004. Globin gene activation during haemopoiesis is driven by protein complexes nucleated by GATA-1 and GATA-2. EMBO J. 23:2841–2852. - PMC - PubMed
    1. Bantignies, F., C. Grimaud, S. Lavrov, M. Gabut, and G. Cavalli. 2003. Inheritance of Polycomb-dependent chromosomal interactions in Drosophila. Genes Dev. 17:2406–2420. - PMC - PubMed
    1. Boyle, S., S. Gilchrist, J. Bridger, N. Mahy, J. Ellis, and W. Bickmore. 2001. The spatial organization of human chromosomes within the nuclei of normal and emerin-mutant cells. Hum. Mol. Genet. 10:211–219. - PubMed
    1. Brown, J., K. Saracoglu, S. Uhrig, M. Speicher, R. Eils, and L. Kearney. 2001. Subtelomeric chromosome rearrangements are detected using an innovative 12-color FISH assay (M-TEL). Nat. Med. 7:497–501. - PubMed
    1. Brown, K., S. Guest, S. Smale, K. Hahm, M. Merkenschlager, and A. Fisher. 1997. Association of transcriptionally silent genes with Ikaros complexes at centromeric heterochromatin. Cell. 91:845–854. - PubMed

Publication types