

Accelerated lipid absorption in mice overexpressing intestinal SR-BI
- PMID: 16421100
- PMCID: PMC2034750
- DOI: 10.1074/jbc.M508868200
Accelerated lipid absorption in mice overexpressing intestinal SR-BI
Abstract
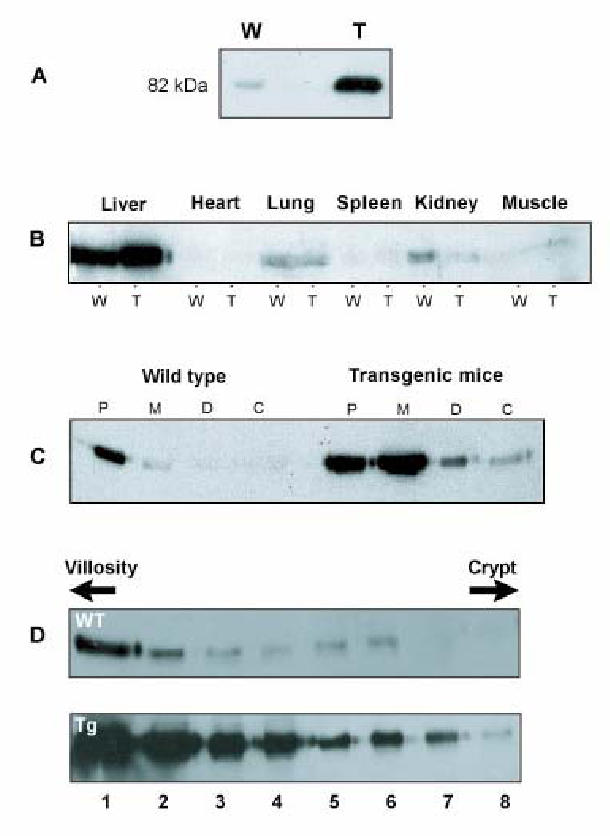
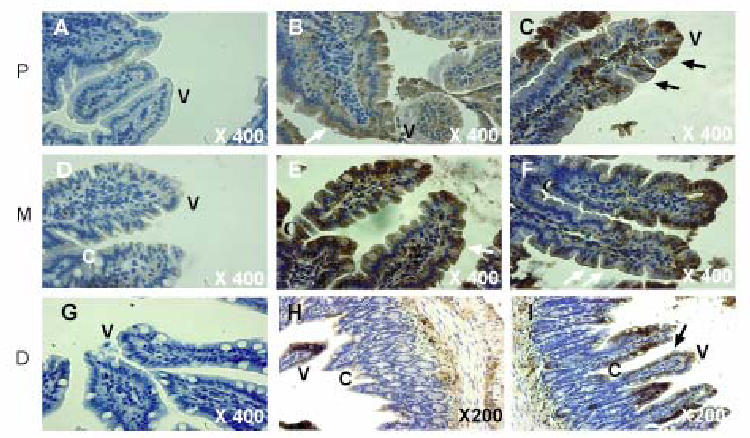
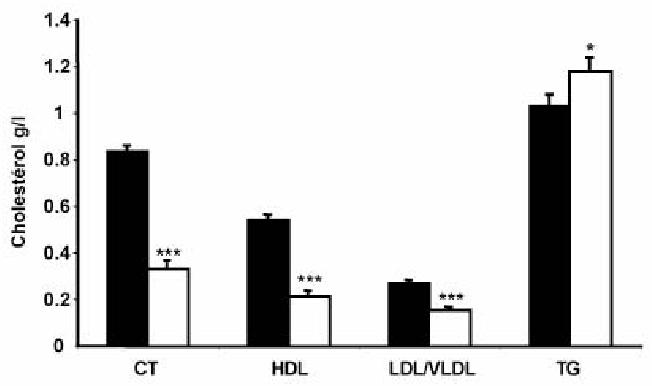
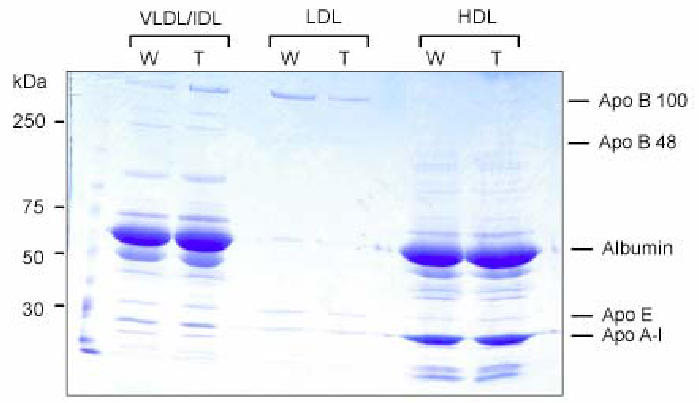
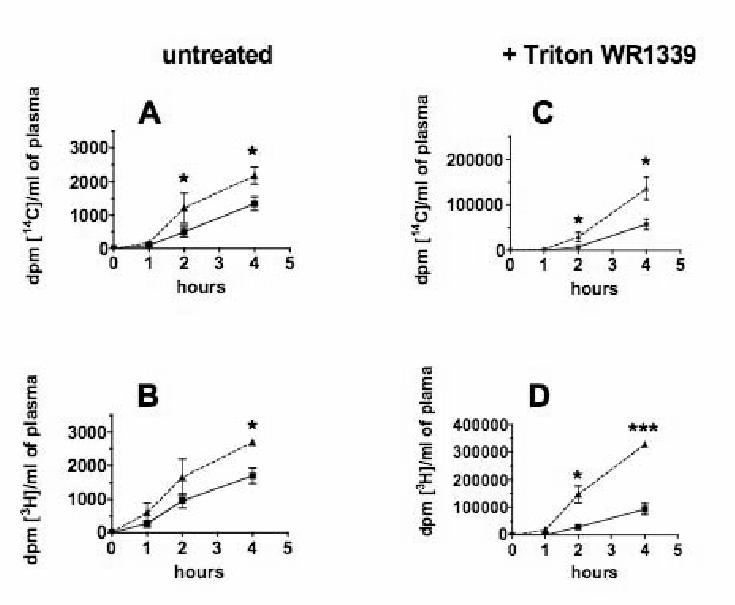
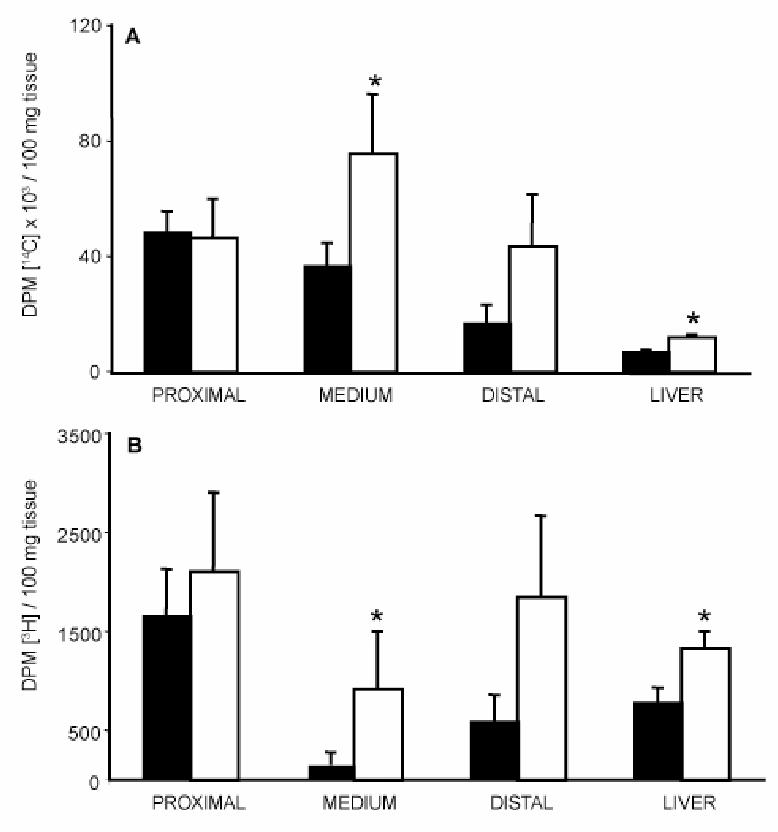
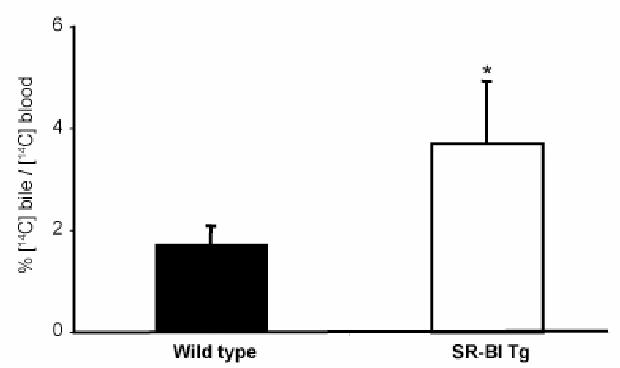
Dietary cholesterol absorption contributes to a large part of the circulating cholesterol. However, the mechanism of sterol intestinal uptake is not clearly elucidated. Scavenger receptor class B type I (SR-BI), major component in the control of cholesterol homeostasis, is expressed in the intestine, but its role in this organ remains unclear. We have generated transgenic mice overexpressing SR-BI primarily in the intestine by using the mouse SR-BI gene under the control of intestinal specific "apoC-III enhancer coupled with apoA-IV promoter." We found SR-BI overexpression with respect to the natural protein along the intestine and at the top of the villosities. After a meal containing [(14)C]cholesterol and [(3)H]triolein, SR-BI transgenic mice presented a rise in intestinal absorption of both lipids that was not due to a defect in chylomicron clearance nor to a change in the bile flow or the bile acid content. Nevertheless, SR-BI transgenic mice showed a decrease of total cholesterol but an increase of triglyceride content in plasma without any change in the high density lipoprotein apoA-I level. Thus, we described for the first time a functional role in vivo for SR-BI in cholesterol but also in triglyceride intestinal absorption.
Figures
Similar articles
-
Hepatic cholesterol and bile acid metabolism and intestinal cholesterol absorption in scavenger receptor class B type I-deficient mice.J Lipid Res. 2001 Feb;42(2):170-80. J Lipid Res. 2001. PMID: 11181745
-
Down-regulation of intestinal scavenger receptor class B, type I (SR-BI) expression in rodents under conditions of deficient bile delivery to the intestine.Biochem J. 2001 Jun 1;356(Pt 2):317-25. doi: 10.1042/0264-6021:3560317. Biochem J. 2001. PMID: 11368757 Free PMC article.
-
Susceptibility to murine cholesterol gallstone formation is not affected by partial disruption of the HDL receptor SR-BI.Biochim Biophys Acta. 2002 Jul 11;1583(2):141-50. doi: 10.1016/s1388-1981(02)00194-4. Biochim Biophys Acta. 2002. PMID: 12117558
-
The role of scavenger receptor class B type I (SR-BI) in lipid trafficking. defining the rules for lipid traders.Int J Biochem Cell Biol. 2004 Jan;36(1):39-77. doi: 10.1016/s1357-2725(03)00173-0. Int J Biochem Cell Biol. 2004. PMID: 14592533 Review.
-
The role of the high-density lipoprotein receptor SR-BI in cholesterol metabolism.Curr Opin Lipidol. 2000 Apr;11(2):123-31. doi: 10.1097/00041433-200004000-00004. Curr Opin Lipidol. 2000. PMID: 10787173 Review.
Cited by
-
A genetic dissection of intestinal fat-soluble vitamin and carotenoid absorption.Hum Mol Genet. 2015 Jun 1;24(11):3206-19. doi: 10.1093/hmg/ddv072. Epub 2015 Feb 20. Hum Mol Genet. 2015. PMID: 25701869 Free PMC article.
-
Intestinal CREBH overexpression prevents high-cholesterol diet-induced hypercholesterolemia by reducing Npc1l1 expression.Mol Metab. 2016 Sep 17;5(11):1092-1102. doi: 10.1016/j.molmet.2016.09.004. eCollection 2016 Nov. Mol Metab. 2016. PMID: 27818935 Free PMC article.
-
Milk phospholipid and plant sterol-dependent modulation of plasma lipids in healthy volunteers.Eur J Nutr. 2013 Apr;52(3):1169-79. doi: 10.1007/s00394-012-0427-0. Epub 2012 Jul 27. Eur J Nutr. 2013. PMID: 22836514 Clinical Trial.
-
Lipid rafts: dream or reality for cholesterol transporters?Eur Biophys J. 2007 Nov;36(8):869-85. doi: 10.1007/s00249-007-0193-8. Epub 2007 Jun 19. Eur Biophys J. 2007. PMID: 17576551 Review.
-
GATA4 is essential for jejunal function in mice.Gastroenterology. 2008 Nov;135(5):1676-1686.e1. doi: 10.1053/j.gastro.2008.07.074. Epub 2008 Aug 3. Gastroenterology. 2008. PMID: 18812176 Free PMC article.
References
-
- Dawson PA, Rudel LL. Curr Opin Lipidol. 1999;10:315–320. - PubMed
-
- Ros E. Atherosclerosis. 2000;151:357–379. - PubMed
-
- Compassi S, Werder M, Boffelli D, Weber FE, Hauser H, Schulthess G. Biochemistry. 1995;34:16473–16482. - PubMed
-
- Thurnhofer H, Hauser H. Biochemistry. 1990;29:2142–2148. - PubMed
-
- Schulthess G, Compassi S, Boffelli D, Werder M, Weber FE, Hauser H. J Lipid Res. 1996;37:2405–2419. - PubMed
Publication types
MeSH terms
Substances
LinkOut - more resources
Full Text Sources
Molecular Biology Databases
Research Materials
