. 2006 Apr;17(4):1910-21.
doi: 10.1091/mbc.e05-10-0971. Epub 2006 Jan 18.

CD99 acts as an oncosuppressor in osteosarcoma

Affiliations

CD99 acts as an oncosuppressor in osteosarcoma

Maria Cristina Manara et al. Mol Biol Cell. 2006 Apr.

Abstract

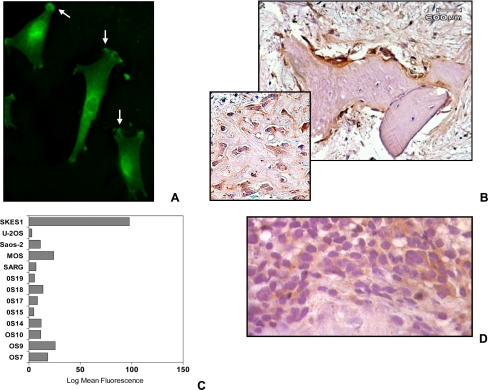
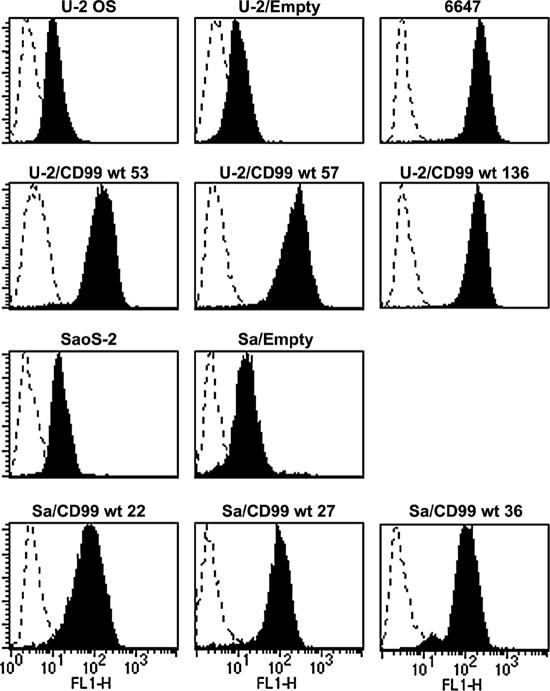
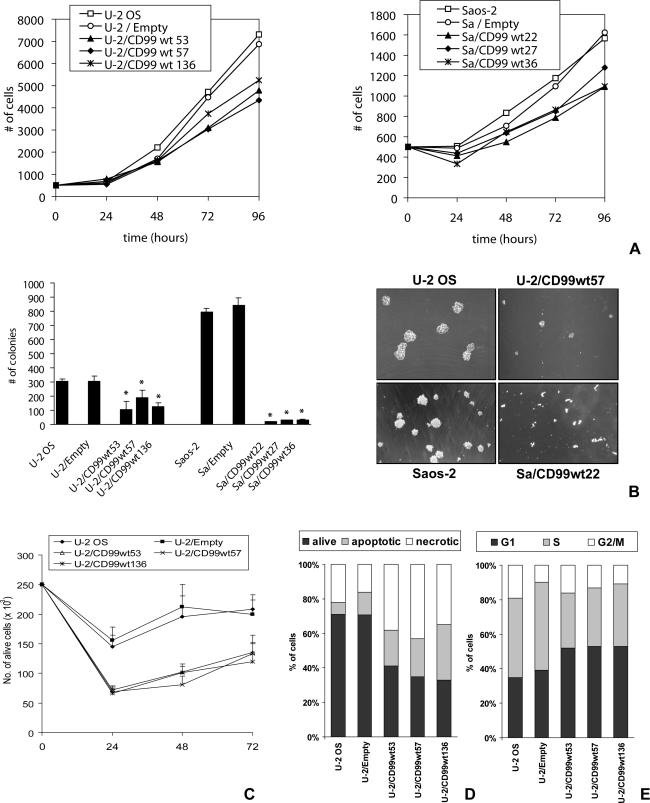
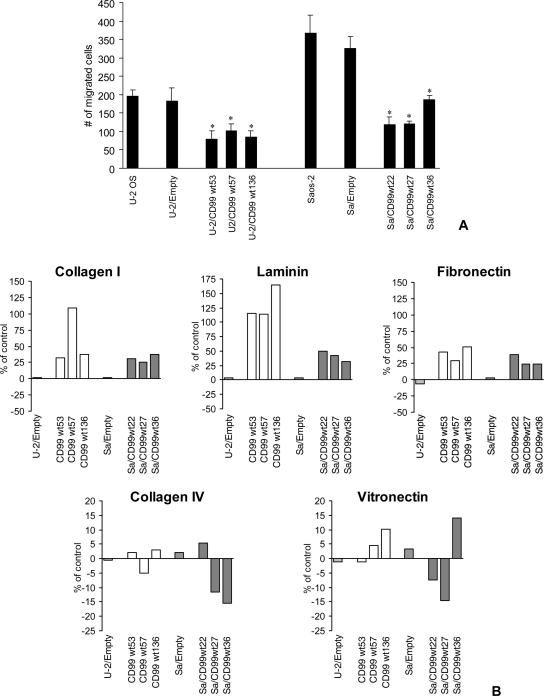
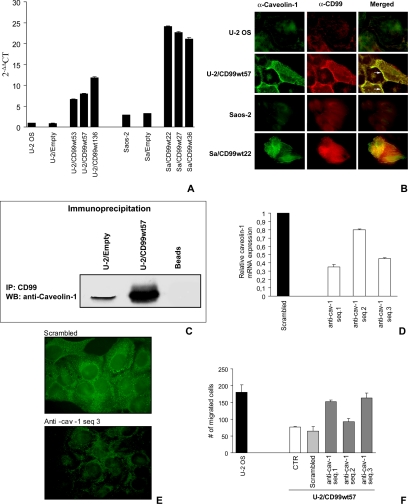
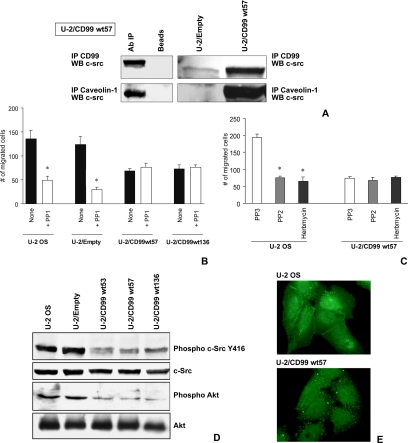
CD99 was recently reported to be under control of the osteoblast-specific transcription factor Cbfa1 (RUNX2) in osteoblasts, suggesting a role in the phato-physiology of these cells. No extensive information is available on the role(s) of this molecule in malignant phenotype, and osteosarcoma, in particular, has never been studied. We report that in 11 different cell lines and 17 clinical samples CD99 expression is either undetectable or very low. Being expressed in the normal counterpart, we tested the hypothesis that CD99 down-regulation may have a role in osteosarcoma development and progression. CD99-forced expression in two osteosarcoma cell lines significantly reduced resistance to anoikis, inhibited growth in anchorage independence as well as cell migration, and led to abrogation of tumorigenic and metastatic ability. Therefore, the molecule acts as a potent suppressor of malignancy in osteosarcoma. CD99 gene transfection induces caveolin-1 up-regulation and the two molecules were found to colocalize on the cell surface. Treatment with antisense oligonucleotides to caveolin-1 abrogates the effects of CD99 on migration. The findings point to an antioncogenic role for CD99 in osteosarcoma, likely through the regulation of caveolin-1 and inhibition of c-Src kinase activity.


Figures

Figure 1.
Figure 1.
Expression of CD99 in osteoblasts and osteosarcoma. (A) CD99 was particularly evident in the cell adhesion structures (arrowheads) of osteblasts maintained in cell culture for 21 d. (B) Bone callus tissue sample was used to check the expression of CD99 in osteoblasts. The level of expression was higher when osteoblasts adhered to each other and lined the bone surface (arrowheads) compared with less differentiated osteoblasts included in immature bone matrix, as shown in the inset. (C) Cytofluorometric expression of CD99 in a panel of osteosarcoma cell lines. The Ewing's sarcoma cell line SK-ES-1 was used as positive control. (D) Representative osteosarcoma sample that shows positivity to CD99. Note the low level of expression.
Figure 2.
Figure 2.
Expression of CD99 isoforms in U-2 OS- and Saos-2–transfected cells. Relative expression of CD99 in U-2 OS and Saos-2 clones by cytofluorometry Open profile represents cells stained with secondary antibody alone; solid profile represents cells stained with the anti-CD99 antibody. In each panel, the ordinate represents the number of cells. Similar extracellular expression of CD99 was observed in all the transfectants. 6647 Ewing's sarcoma cells were also included as positive control.
Figure 3.
Figure 3.
In vitro growth features of U-2 OS and Saos-2 cells and CD99 derived clones. (A) Cell growth curves in IMDM 10% FBS. (B) Growth in soft agar of parental osteosarcoma cells and CD99 derived clones. Cells were seeded at a concentration of 10,000–33,000 cells, and the number of colonies in triplicate plates was determined after 10 d of growth in 10% FBS. Data are expressed as means of six plates ± SE (*p < 0.05, Student's t test) with respect to U-2 OS parental cells. (C) Survival of U-2 OS cells and derived clones on poly-HEMA–coated dishes. Cells (250,000) were seeded on poly-HEMA–coated dishes in IMDM 10% FBS. The number of live cells per plate was determined by trypan blue vital cell count at the times indicated on the abscissa. Data represent the mean ± SE of duplicate experiments. (D) Cytofluorometric analysis of apoptotic U-2 OS cells and derivates by Annexin-V and propidium iodide after 24 h. Data represent the mean of triplicate experiments. (E) Cell cycle analysis of U-2 OS cells and CD99-derived clones in basal conditions. Data are from an experiment representative of two independent experiments.
Figure 4.
Figure 4.
Adhesive and migratory features of parental osteosarcoma cells and CD99-derived clones. (A) Migration ability of U-2 OS and Saos-2 cells and CD99-transfected cells. Cells were seeded in the upper compartment of a transwell chamber; in the lower compartment, IMDM 10% FBS was used as the source of chemoattractant. Each column represents the mean ± SE of three independent experiments. *p < 0.05; Student's t test. (B) Effects of CD99 expression on the adhesive properties of U-2 OS and Saos-2 CD99-transfected cells. Cells were plated on wells coated with different ECM components accordingly to the manufacturer's instructions. After 1 h, the number of adherent cells was determined after incubation with crystal violet. Data, which are means of four to six plates, are expressed as percentage of parental cell line mean values.
Figure 5.
Figure 5.
Graphical representation of up-regulated genes in U-2/CD99 transfectants compared with parental cells and U-2/Empty cells. Three hundred twenty-six genes showed significantly different higher levels of expression in both U-2/CD99wt57 and U-2/CD99wt136 compared with control cells. The up-modulated genes were grouped according to cellular component and biological functions by using Fatigo program.
Figure 6.
Figure 6.
Caveolin-1 is required for CD99 functions in modulating osteosarcoma migratory abilities. (A) Relative expression of caveolin-1 mRNA in U-2 OS and Saos-2 cells transfected with anti-CD99. The relative target gene mRNAs expression of U-2 OS parental cells was used as a calibrator (2-ΔΔCT = 1). Data expressed as mean values ± SE. (B) Immunostaining of caveolin-1 and CD99 on adherent cells. Caveolin is labeled by anti-caveolin MAb and revealed by FITC-conjugated anti-mouse IgM. CD99 is labeled by the anti-CD99 013 MAb and revealed by Cy3-conjugated anti-mouse IgG. U2OS and Saos-2 parental cells express low levels of caveolin-1 and CD99. Cells overexpressing wild-type CD99 (U2/CD99 wt57 or Sa/CD99wt22) accumulate caveolin-1 at the cell membrane. Colocalization of CD99 and caveolin-1 at the cell membrane is shown in the merged image, and it is indicated by arrows. (C) Immunoprecipitation of CD99 from U-2/CD99wt57 and U-2/Empty cells was followed by immunoblotting with anti-caveolin-1 antibody. Note that caveolin-1 coimmunoprecipitates with CD99A signal, but much weaker than in U-2/CD99wt57 cells, as was observed also in U-2/Empty cells, likely because of the cells expressing both the molecules, although at very low levels. (D) Real-time analysis of caveolin-1 expression in U-2/CD99wt57 cells after 72-h pretreatment with 3 μM scramble or three different caveolin-1 antisense oligonucleotide sequences. (E) Immunostaining of caveolin-1 in U-2/CD99wt57 cells after 72-h pretreatment with 3 μM scramble or caveolin-1 antisense oligonucleotide sequences. (F) Migratory ability of U-2/CD99wt57 cells after 72-h pretreatment with 3 μM scramble or three different caveolin-1 antisense oligonucleotide sequences.
Figure 7.
Figure 7.
C-Src colocalizes with caveolin-1 and with CD99, and c-Src kinase activity is inhibited in CD99-transfected cells. (A) Immunoprecipitation of CD99 or caveolin-1 from U-2/CD99wt57 and U-2/Empty cells was followed by immunoblotting with anti-c-Src antibody. Note that c-Src coimmunoprecipitates with both the two molecules. (B and C) Migratory ability of U-2 OS and CD99-transfected cells after treatment with the c-Src inhibitor PP1 (2.5 μM) or PP2 (5 μM) or herbimycin (2 μM). The PP3 compound (5 μM) is a negative control for Src family tyrosine kinase inhibitors PP1 and PP2, despite that it inhibits the activity of epidermal growth factor receptor kinase. (D and E) Evaluation of c-Src kinase activity in CD99-transfected cells. (D) Phosphorylation of c-Src at tyrosine 416 (Y416) as well as phosphorylation of Akt was analyzed by Western blotting. Membrane were stripped and reblotted with antibodies against total c-Src and Akt as control. (E) Fluorescent immunostaining of Y416 phosphorylation in U-2 OS and U-2/CD99wt 57 cells.

References

    1. Alberti, I., Bernard, G., Rouquette-Jazdanian, A. K., Pelassy, C., Pourtein, M., Aussel, C., and Bernard, A. (2002). CD99 isoforms expression dictates T cell functional outcomes. FASEB J. 16, 1946-1948. - PubMed
    1. Ambros, I. M., Ambros, P. F., Strehl, S., Kovar, H., Gadner, H., and Salzer Kuntschik, M. (1991). MIC2 is a specific marker for Ewing's sarcoma and peripheral primitive neuroectodermal tumors. Evidence for a common histogenesis of Ewing's sarcoma and peripheral primitive neuroectodermal tumors from MIC2 expression and specific chromosome aberration. Cancer 67, 1886-1893. - PubMed
    1. Banting, G. S., Pym, B., Darling, S. M., and Goodfellow, P. N. (1989). The MIC2 gene product: epitope mapping and structural prediction analysis define an integral membrane protein. Mol. Immunol. 26, 181-188. - PubMed
    1. Bernard, G., Breittmayer, J. P., de Matteis, M., Trampont, P., Hofman, P., Senik, A., and Bernard, A. (1997). Apoptosis of immature thymocytes mediated by E2/CD99. J. Immunol. 158, 2543-2550. - PubMed
    1. Bernard, G., Raimondi, V., Alberti, I., Pourtein, M., Widjenes, J., Ticchioni, M., and Bernard, A. (2000). CD99 (E2) up-regulates alpha4beta1-dependent T cell adhesion to inflamed vascular endothelium under flow conditions. Eur. J. Immunol. 30, 3061-3065. - PubMed

Publication types

MeSH terms