Comparative Study
. 2006 Jan 18;26(3):763-74.
doi: 10.1523/JNEUROSCI.2489-05.2006.

Essential contribution of the ligand-binding beta B/beta C loop of PDZ1 and PDZ2 in the regulation of postsynaptic clustering, scaffolding, and localization of postsynaptic density-95

Affiliations
Comparative Study

Essential contribution of the ligand-binding beta B/beta C loop of PDZ1 and PDZ2 in the regulation of postsynaptic clustering, scaffolding, and localization of postsynaptic density-95

Mio Nonaka et al. J Neurosci. .

Abstract

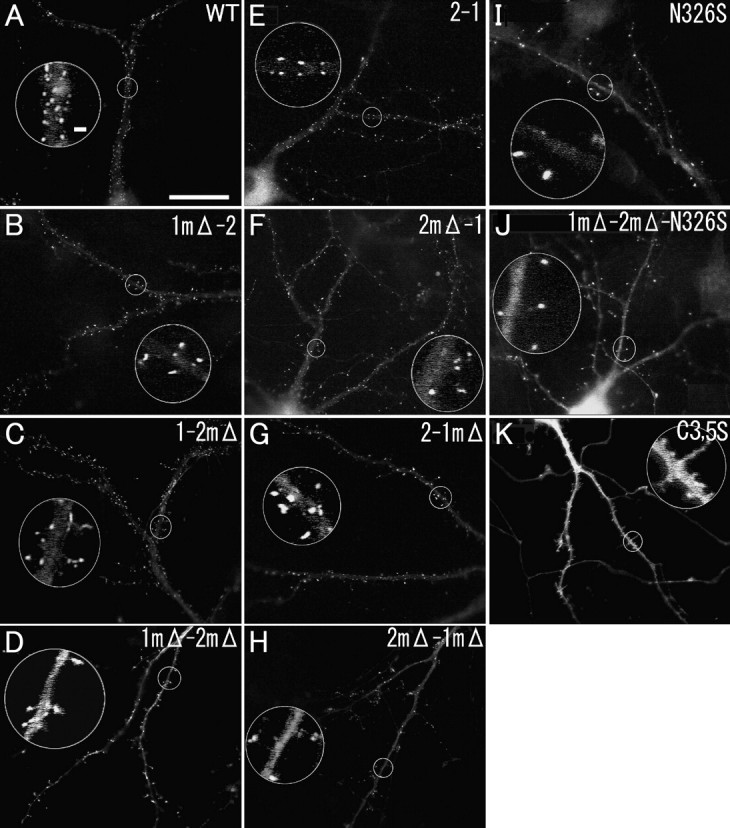
Postsynaptic density-95 (PSD-95), a PSD-95/Discs large/zona occludens-1 (PDZ) domain-containing scaffold protein, clusters many signaling molecules near NMDA-type glutamate receptors in the postsynaptic densities. Although the synaptic localization of PSD-95 requires palmitoylation of two cysteines at the N terminus and the presence of at least one PDZ domain, how the clustering of PSD-95 is initiated and regulated remains essentially unknown. To address this issue, we examined PSD-95 clustering in primary cultured hippocampal neurons expressing full-length PSD-95 mutant proteins lacking the ligand-binding ability of PDZ1, PDZ2, and/or PDZ3. The formation of either excitatory or inhibitory synapses was unaffected. Combinations of individual mutations, however, significantly reduced the PSD-95 clustering index, in an approximately additive manner. The sensitivity to 2-bromo-palmitate and latrunculin A, reagents known to affect PSD-95 turnover, was also augmented. Furthermore, the synaptic recruitment of a PSD-95 ligand, synaptic GTPase-activating protein (synGAP), was significantly impaired, whereas the clustering of other scaffolding proteins, such as Homer 1c, Shank/Synamon, and PSD-93/Chapsin-110 was spared. Intriguingly, overexpression of the PSD-95 PDZ1/2/3 mutants caused the PSD-95 clusters to localize away from the dendritic shaft, resulting in the formation of elongated spines, in an inverse correlation with the overall PDZ-ligand affinity. Expression of a mutant synGAP lacking the PDZ-binding motif replicated both the clustering and spine morphology phenotypes. In conclusion, the ligand-binding affinity of the PDZ domains of PSD-95, contributed in part via its interaction with the C-terminal end of synGAP, plays a critical role in titrating the synaptic clustering of PSD-95 and controlling its tight association with the PSD scaffold, thereby affecting synapse maturation.


Figures

Figure 1.
Figure 1.
Schematic diagram of the domain structures of the series of PSD-95–GFP mutants and the wild type. The top panel shows the domain structure of PSD-95 tagged with GFP at the C terminus. The mutant illustrations show the N-terminal segment of PSD-95, including only the PDZ domains. PDZ1mΔ and PDZ2mΔ represent the PDZ1 and PDZ2 domains, respectively, with deletions of six amino acids (intervals) and point mutations that abolished their ligand-binding activity. The PDZ3 domain with the N326S point mutation (black vertical bar) has weak ligand-binding activity.
Figure 2.
Figure 2.
Wild-type and mutant PSD-95 form postsynaptic clusters apposed to the glutamatergic synaptic boutons. The PSD-95(WT)–GFP, 1mΔ-2mΔ, and N326S (A–C and green in J–L, respectively) form clusters juxtaposed to puncta immunopositive for an excitatory presynaptic marker, anti-VGLUT1 (D–F and red in J–L). No cluster colocalized with puncta positive for an inhibitory presynaptic marker, anti-VGAT (G–I and blue in J–L). The bottom images are merged images in which PSD-95–GFP staining is green, VGLUT1 staining is red, and VGAT staining is blue. Scale bar, 10 μm.
Figure 3.
Figure 3.
Synaptic clustering of PSD-95 is diminished by PDZ-ligand-binding mutations. GFP fluorescent images were taken from transfected hippocampal neurons expressing the wild-type (A) and the series of mutant PSD-95–GFPs (B–K). A, E, The wild-type and the 2–1 (inversion of PDZ1 and PDZ2, with intact ligand-binding affinity) mutant formed bright shaft clusters. Note that the majority of the clusters are shaft clusters. B, C, F, G, When either the PDZ1 or PDZ2 domain is mutated, the clustering activity is slightly reduced. A significant number of clusters are formed at some distance from the dendritic shaft, indicating their presence on spine-like protrusions. D, H, Mutations in both PDZ1 and PDZ2 reveal clusters located farther away, on the tips of longer protrusions. In contrast to the WT, the fluorescence intensity of these clusters is not substantially higher compared with the mean dendritic shaft intensity. I, The N326S mutation in the PDZ3 domain also reduces the clustering efficiency. J, 1mΔ–2mΔ–N326S, the mutant that lacks functional PDZ domains, forms discernible clusters juxtaposed to the presynaptic markers, but the clustering efficiency is extremely low. The clusters are even farther from their parent dendritic shafts. All of the ligand-binding-deficient mutants are distinct from the C3,5S mutant (K) in that they form punctate clusters. Scale bars: 20μm; inset, 1μm. The insets are the magnified images of the areas outlined by white circles in the images. All of the insets have the same magnification.
Figure 4.
Figure 4.
Individual PDZ domains independently and additively contribute to postsynaptic clustering of PSD-95. The SCI was measured as the peak GFP intensity of the synaptic PSD-95–GFP clusters divided by the average intensity of the parent dendritic shaft. Wild-type PSD-95 forms clusters that are 5.64 ± 0.73 times as bright as the parent dendritic shaft, on average. In contrast, the 1mΔ–2mΔ mutant forms clusters with an SCI of approximately half of the wild type (SCI, 2.79 ± 0.298; p < 0.05 vs WT). Open bars and error bars are means ± SEM of the cell averages (n = 6–11 cells), and open circles represent the average of each cell (20–100 clusters per cell). We confirmed that the SCI values of each cluster in a cell conformed to a normal distribution. Each dataset was statistically analyzed by one-way ANOVA, with the post hoc Dunnett's test. *p < 0.05 versus WT.
Figure 5.
Figure 5.
SynGAP immunoreactivity is significantly reduced in the postsynaptic clusters of 1mΔ–2mΔ PSD-95-expressing neurons compared with the wild-type PSD-95-expressing neurons. A, SynGAP IF images of the cells expressing PSD-95(WT)–GFP and 1mΔ–2mΔ–N326S are shown in grayscale. The staining signal is significantly reduced in the postsynaptic clusters of the 1mΔ–2mΔPSD-95-expressing neurons compared with the wild-type PSD-95-expressing neurons. Scalebar, 10 μm. B–E, Graphs represent the plots of the IF intensities of synGAP (B), Homer (C), Shank (D), and PSD-93 (E) versus the PSD-95–GFP intensities of the clusters in the neurons expressing wild-type or mutant PSD-95–GFP (black open squares, wild type; blue open squares, 1mΔ–2mΔ mutant; red open squares, 1mΔ–2mΔ–N326S mutant; filled squares, their averages). Insets are the plots of each cluster observed in one representative neuron. In the main graphs, each small square with bars indicates the averaged value ± SEM of each neuron [GFP intensity to the x-axis (arbitrary units) and IF intensity to the y-axis(arbitrary units)]. All of the cells analyzed expressed approximately similar amounts of PSD-95–GFP in the dendritic shaft, regardless of the mutant type. Therefore, the PSD-95–GFP intensities reflect the SCI values. B, The IF intensities of a major PSD-95 ligand, synGAP, are significantly lower in the 1mΔ–2mΔ–N326S clusters (B1, red) and the 1mΔ–2mΔ clusters (B2, blue) compared with the PSD-95(WT)–GFP clusters (black). C–E, In contrast, using the same assay, the IF intensities for other scaffold proteins distinct from PSD-95, such as Homer-1c (C), Shank/Synamon (D), and PSD-93/Chapsin-110 (E), are not significantly altered in the postsynaptic clusters (p > 0.5). *p < 0.05 versus WT by Student's t test.
Figure 6.
Figure 6.
Ligand-binding-deficient mutants are more loosely anchored to the postsynaptic membrane than the wild type. A, Synaptic clusters in neurons expressing ligand-binding-deficient PSD-95 mutants are rapidly dispersed in response to treatment with a palmitoylation blocker, 2-Br-Pal. 2-Br-Pal dramatically reduces the clustering efficiencies in neurons expressing the mutant PSD-95 (1mΔ–2mΔ–N326S) but only moderately in neurons expressing the wild-type PSD-95. Grayscale images show the PSD-95–GFP fluorescence of the wild-type and 1mΔ–2mΔ-expressing neurons treated with DMSO or 2-Br-Pal for 2 or 8 h. The top graph summarizes the results of the SCI analysis of the DMSO-treated or 100μm 2-Br-Pal-treated wild-type and 1mΔ–2mΔ-expressing neurons. The bottom graph shows the cluster density (number of clusters per 20 μm dendritic segment) of the same datasets. *p < 0.01 versus the SCI of DMSO2 h by the Student's t test. B, Increased susceptibility to an actin-depolymerizing drug (LatA) in neurons expressing a ligand-binding-deficient mutant. Actin depolymerization by 5μm latrunculin A caused much faster cluster dissociation in the 1mΔ–2mΔ mutant PSD-95-expressing neurons. Grayscale images of the wild-type and 1mΔ–2mΔ-expressing neurons treated with LatA for 0, 1.5, and 17 h. The small images below are the colored images (PSD-95–GFP, green) merged with synaptophysin staining (red) of the areas outlined by the white rectangles in the grayscale images. The graph shows the SCI values of the LatA-treated and nontreated wild-type and 1mΔ–2mΔ-expressing neurons. Raw values are shown as bar graphs (left y-axis), and scaled values (normalized to SCI at 0 h) are shown as line graphs (right y-axis). *p < 0.01 versus the SCI of nontreated (0 h) WT and 1mΔ–2mΔ, respectively, by the Student's t test. Scale bars, 10 μm.
Figure 7.
Figure 7.
The cluster-shaft distance is increased in the mutant-expressing neurons compared with the wild-type-expressing neurons and negatively correlates with the SCI value. A, Ligand-binding-deficient PSD-95 mutants formed clusters on tips of protrusions (spines) away from the dendritic shafts. The distance from the center of the synaptic clusters to the edge of the parent dendritic shaft was measured on the same dataset of cells used to calculate the SCI (Figs. 3, 4). To the shaft clusters (clusters that appeared to be formed directly on the dendritic shaft), the value 0 was arbitrarily assigned. Bars and error bars represent the averages and the SEMs of the calculated means of each cell (open dots). The error bars of WT and 2–1 are exceptionally small, because these cells predominantly have shaft clusters to which we applied the same values equally, and the large fraction of the shaft clusters will result in average distances below 0.2 μm. *p < 0.05 versus WT. B, The SCI is negatively correlated with the cluster-shaft distance. The average SCI and the average cluster-shaft distance, the distance from the PSD-95 clusters to the dendritic shaft, of the wild type and each mutant type (n = 6–10 cells per mutant type), are plotted on the x-axis and y-axis, respectively. Error bars indicate SEM. The broken line shows the fitted regression line (r =–0.8637; p < 0.01).
Figure 8.
Figure 8.
Histograms of the cluster-shaft distance distributions in the PSD-95 wild-type- and mutant-expressing neurons. The cumulative probability (right y-axis) of the cluster distances for each individual cell is traced (lines with open circles), and the aggregate data are traced (thicker lines with filled squares). The frequency histogram of the aggregate data were superimposed (left y-axis). Note that, in the mutant-expressing neurons, the cluster-shaft distance distribution cannot be fitted with a single Gaussian distribution, because they have a substantial portion of nonshaft clusters. This discrepancy is statistically significant. *p < 0.05 and **p < 0.001 versus WT by Kolmogorov–Smirnov test.
Figure 9.
Figure 9.
Overexpression of a mutant synGAP lacking the C-terminal PDZ-binding motif results in a severe defect in the PSD-95 cluster formation and a significant increase in the PSD-95 cluster-shaft distance. A, Immunolocalization of PSD-95 clusters [PSD-95(WT)–GFP] and synGAP in neurons coexpressing the wild-type PSD-95 and either the wild-type synGAP (TRV, top panels) or the PDZ-binding motif mutant synGAP (ΔSXV, bottom panels). Neurons were cotransfected at 8 DIV and fixed at 10 DIV. The coexpression of wild-type synGAP(TRV) with wild-type PSD-95 did not result in a detectable change in the clustering efficiency and cluster density compared with the overexpression of PSD-95(WT)–GFP alone. Remarkably, during coexpression with synGAP(ΔSXV), PSD-95(WT)–GFP displayed an aberrant dendritic distribution that was similar to the phenotypes seen with the ligand-binding-deficient PSD-95 mutant (i.e., 1mΔ–2mΔ). B–D, Quantification of the defects seen in synaptic cluster formation and in spine morphology. Based on the images of PSD-95–GFP, the SCI values (B), the cluster density (the number of synaptic clusters per 20 μm dendritic segment) (C), and the cluster-shaft distance (D) were measured in the neurons expressing the indicated constructs and are shown as bar graphs. We confirmed that the PSD-95 clusters analyzed were all juxtaposed to the synaptophysin-staining puncta. Scale bar, 10 μm. *p < 0.05, **p < 0.01, by one-way ANOVA with post hoc Tukey's test (n = 12–16 neurons); or *p < 0.05, **p < 0.01, by the Student's t test in the experimental pairs of PSD-95(WT)–GFP only and PSD-95(1mΔ–2mΔ)–GFP only.

References

    1. Allison DW, Gelfand VI, Spector I, Craig AM (1998) Role of actin in anchoring postsynaptic receptors in cultured hippocampal neurons: differential attachment of NMDA versus AMPA receptors. J Neurosci 18: 2423–2436. - PMC - PubMed
    1. Allison DW, Chervin AS, Gelfand VI, Craig AM (2000) Postsynaptic scaffolds of excitatory and inhibitory synapses in hippocampal neurons: maintenance of core components independent of actin filaments and microtubules. J Neurosci 20: 4545–4554. - PMC - PubMed
    1. Arnold DB, Clapham DE (1999) Molecular determinants for subcellular localization of PSD-95 with an interacting K+ channel. Neuron 23: 149–157. - PubMed
    1. Brenman JE, Topinka JR, Cooper EC, McGee AW, Rosen J, Milroy T, Ralston HJ, Bredt DS (1998) Localization of postsynaptic density-93 to dendritic microtubules and interaction with microtubule-associated protein 1A. J Neurosci 18: 8805–8813. - PMC - PubMed
    1. Chen HJ, Rojas-Soto M, Oguni A, Kennedy MB (1998) A synaptic Ras-GTPase activating protein (p135 SynGAP) inhibited by CaM kinase II. Neuron 20: 895–904. - PubMed

Publication types

MeSH terms