. 2006 Apr 1;572(Pt 1):227-41.
doi: 10.1113/jphysiol.2005.102020. Epub 2006 Jan 19.

Mechanisms underlying variations in excitation-contraction coupling across the mouse left ventricular free wall

Affiliations

Mechanisms underlying variations in excitation-contraction coupling across the mouse left ventricular free wall

Keith W Dilly et al. J Physiol. .

Abstract

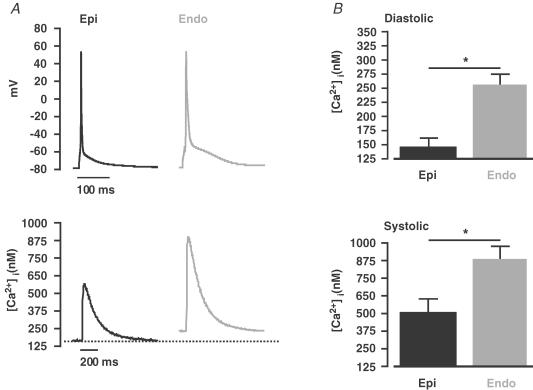
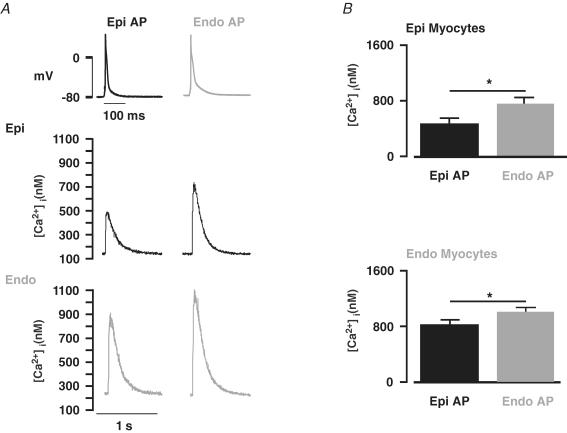
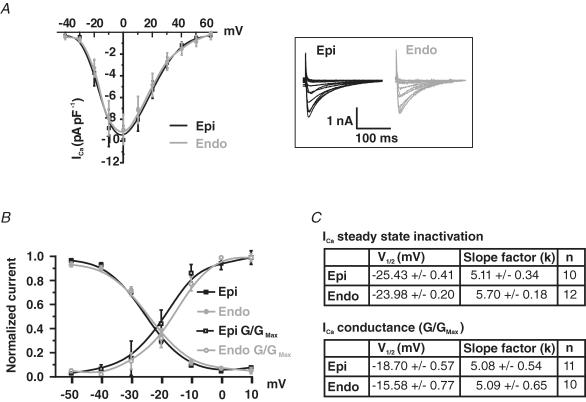
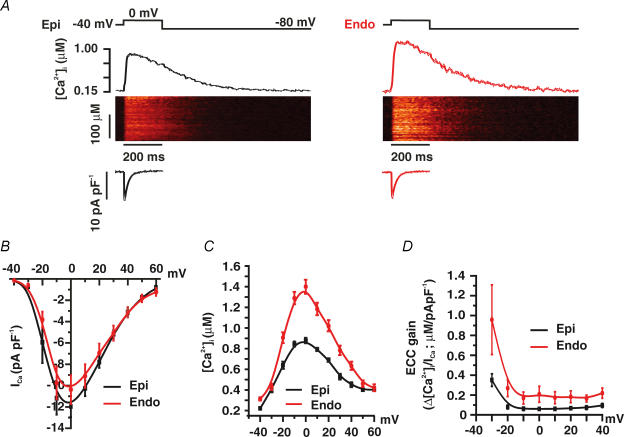
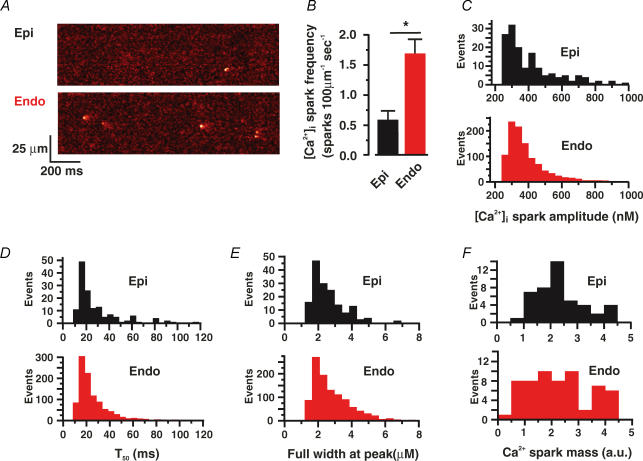
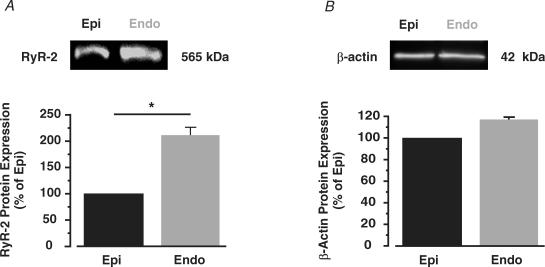
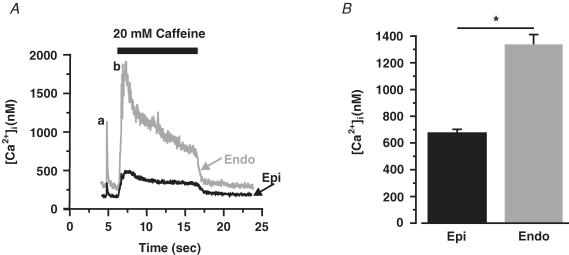
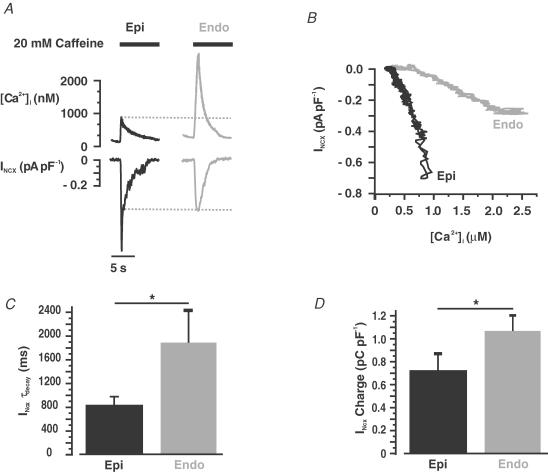
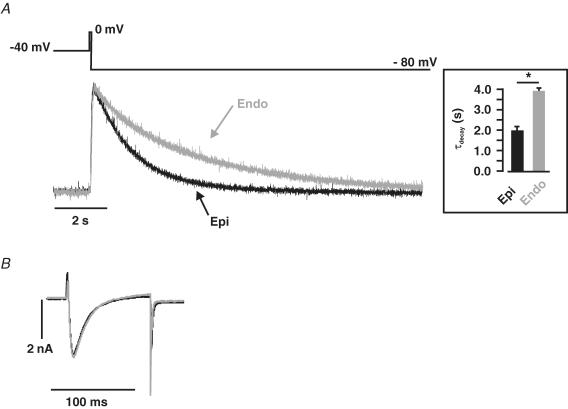
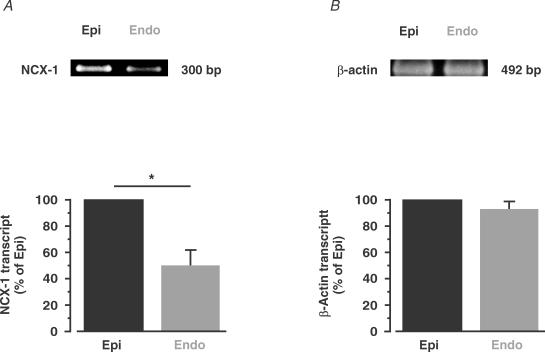
Ca(2+) release during excitation-contraction (EC) coupling varies across the left ventricular free wall. Here, we investigated the mechanisms underlying EC coupling differences between mouse left ventricular epicardial (Epi) and endocardial (Endo) myocytes. We found that diastolic and systolic [Ca(2+)](i) was higher in paced Endo than in Epi myocytes. Our data indicated that differences in action potential (AP) waveform between Epi and Endo cells only partially accounted for differences in [Ca(2+)](i). Rather, we found that the amplitude of the [Ca(2+)](i) transient, but not its trigger - the Ca(2+) current - was larger in Endo than in Epi cells. We also found that spontaneous Ca(2+) spark activity was about 2.8-fold higher in Endo than in Epi cells. Interestingly, ryanodine receptor type 2 (RyR2) protein expression was nearly 2-fold higher in Endo than in Epi myocytes. Finally, we observed less Na(+)-Ca(2+) exchanger function in Endo than in Epi cells, which was associated with decreased Ca(2+) efflux during the AP; this contributed to higher diastolic [Ca(2+)](i) and SR Ca(2+) in Endo than in Epi cells during pacing. We propose that transmural differences in AP waveform, SR Ca(2+) release, and Na(+)-Ca(2+) exchanger function underlie differences in [Ca(2+)](i) and EC coupling across the left ventricular free wall.


Figures

Figure 1
Figure 1. Regional differences in [Ca2+]i and AP duration across the left ventricular free wall
A, representative steady-state (1 Hz) APs (top) and [Ca2+]i transients (bottom) from Epi (black) and Endo (grey) cells. The dotted line marks the diastolic [Ca2+]i in Epi cells. B, the bar plot shows the mean ± s.e.m. of the diastolic [Ca2+]i and peak systolic [Ca2+]i transient in Epi and Endo cells. *P < 0.05.
Figure 2
Figure 2. Regional differences in AP waveform contributes to differences in [Ca2+]i between Endo and Epi myocytes
A, [Ca2+]i transients from representative Epi (middle row) and Endo cells (lower row). These [Ca2+]i transients were evoked in Epi and Endo cells with the Epi (left) and Endo (right) AP shown in the top row. B, bar plots of the mean ± s.e.m. of the amplitude of the [Ca2+]i transient in Epi and Endo cells evoked with the Epi and Endo AP. *P < 0.05.
Figure 3
Figure 3. Similar ICa in Epi and Endo cells
A, current–voltage relationship of ICa in Epi and Endo cells. Representative ICa traces are shown to the right (inset). B, ICa steady-state inactivation is shown as a plot of normalized peak current (I/Imax) as a function of conditioning potential. For the voltage dependence of activation, peak ICa currents at test potentials between −50 and +10 mV were converted into conductances (G = ICa/[test pulse potential – reversal potential of ICa]), normalized (G/Gmax), and plotted as a function of test potential. Smooth lines represent best-fit curves to the data determined by a least-squares method using a Boltzmann equation, y = [(A1− A2)/1 + e(VV1/2/k)], where A1, A2, V1/2, and k are the initial value, final value, the voltage at which 50% of the current or conductance was observed, and the slope factor. For the steady-state inactivation of ICa in Epi cells A1 = 1, A2 = 0, V1/2 = −25 mV and k = 5. For the steady-state inactivation of ICa in Endo cells A1 = 1, A2 = 0, V1/2 = −24 mV and k = 6. For the conductance–voltage relationship of ICa in Epi cells A1 = 0, A2 = 1, V1/2 = −19 mV and k = 5. For the conductance–voltage relationship of ICa in Endo cells A1 = 0, A2 = 1, V1/2 = −16 mV and k = 5. C, summary of the parameters used to fit the conductance and steady-state inactivation relationships of ICa in Epi and Endo cells. *P < 0.05.
Figure 4
Figure 4. Higher SR Ca2+ release during EC coupling in Endo than in Epi cells
A, representative ICa and confocal line-scan images from Epi and Endo cells. ICa and [Ca2+]i transients were evoked by a 200 ms voltage step from −40 to 0 mV. Traces showing the time course of ICa and [Ca2+]i in these cells are shown below and above the line-scan images, respectively. B, current–voltage relationships of ICa in Epi and Endo cells. C, voltage dependence of the amplitude of the [Ca2+]i transient in Epi and Endo cells. D, voltage dependence of EC coupling (ECC) gain.
Figure 5
Figure 5. Higher Ca2+ spark activity in Endo than in Epi cells
A, representative confocal line-scan images from Epi and Endo cells. B, bar plot of the mean ± s.e.m. of the frequency of Ca2+ sparks. Histogram plots of amplitude (C), decay time to 50% amplitude (T50) (D), full width at peak amplitude (E), and Ca2+ spark mass (F). *P < 0.05.
Figure 6
Figure 6. Higher RyR2 expression in Endo than in Epi tissue
Western blot analysis of RyR2 (A) and β-actin (B) protein in Epi and Endo tissue. The bar plots show the amount of RyR2 and β-actin protein in Endo relative to Epi cells. *P < 0.05.
Figure 7
Figure 7. Higher SR Ca2+ load in stimulated Endo than in Epi cells
A, representative field (a) and caffeine-induced [Ca2+]i transients (b) in Epi (black) and Endo (red) cells. B, bar plot of the amplitude of the caffeine-induced [Ca2+]i transient in Epi and Endo cells. *P < 0.05.
Figure 8
Figure 8. Larger Ca2+-release-induced INCX in Epi than in Endo cells
A, representative caffeine-induced [Ca2+]i transients and INCX in Epi (left) and Endo (right) cells. B, relationship of [Ca2+]i and INCX in the representative Epi and Endo cells shown in A. Bar plots of INCX time constant of decay (τdecay) (C) and charge (D) in Epi and Endo cells. *P < 0.05.
Figure 9
Figure 9. Faster rate of Ca+ extrusion via the Na+–Ca2+ exchanger in Epi than in Endo cells
A, representative [Ca2+]i records from Epi (black) and Endo (red) cells. Transients were evoked be the voltage protocol shown above the [Ca2+]i traces. Briefly, Epi and Endo cells treated with thapsigargin and caffeine (to eliminate SR Ca2+ accumulation) were depolarized for 100 ms from −40 to 0 mV, after which the cells were hyperpolarized to −80 mV. The inset shows the mean ± s.e.m. of the rate of decay of the [Ca2+]i transient. B, the ICa evoked by this protocol are shown (with an expanded time scale) below the [Ca2+]i traces. *P < 0.05.
Figure 10
Figure 10. Higher Na+–Ca2+ exchanger transcript levels in Epi than in Endo cells
RT-PCR gel of Na+–Ca2+ exchanger (NCX-1; A) and β-actin (B) transcript in Epi and Endo cells. B, the bar plots show the relative level of these proteins in Endo (compared with Epi). *P < 0.05.

References

    1. Balke CW, Egan TM, Wier WG. Processes that remove calcium from the cytoplasm during excitation–contraction coupling in intact rat heart cells. J Physiol. 1994;474:447–462. - PMC - PubMed
    1. Bers DM, Lederer WJ, Berlin JR. Intracellular Ca transients in rat cardiac myocytes: role of Na-Ca exchange in excitation-contraction coupling. Am J Physiol. 1990;258:C944–C954. - PubMed
    1. Blaustein MP, Kao JP, Matteson DR. Cellular Physiology. Philadelphia: Elsevier Mosby; 2004.
    1. Blaustein MP, Lederer WJ. Sodium/calcium exchange: its physiological implications. Physiol Rev. 1999;79:763–854. - PubMed
    1. Brunet S, Aimond F, Guo W, Li H, Eldstrom J, Fedida D, Yamada KA, Nerbonne JM. Heterogeneous expression of repolarizing, voltage-gated K+ currents in adult mouse ventricles. J Physiol. 2004;559:103–120. - PMC - PubMed

Publication types