. 2006 Feb;116(2):485-94.
doi: 10.1172/JCI25439. Epub 2006 Jan 19.

Toll-like receptor 2 controls expansion and function of regulatory T cells

Affiliations

Toll-like receptor 2 controls expansion and function of regulatory T cells

Roger P M Sutmuller et al. J Clin Invest. 2006 Feb.

Abstract

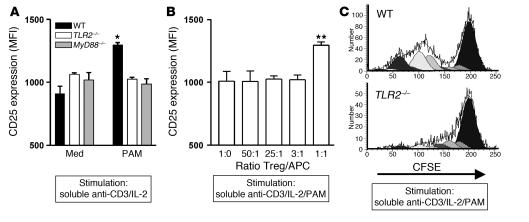
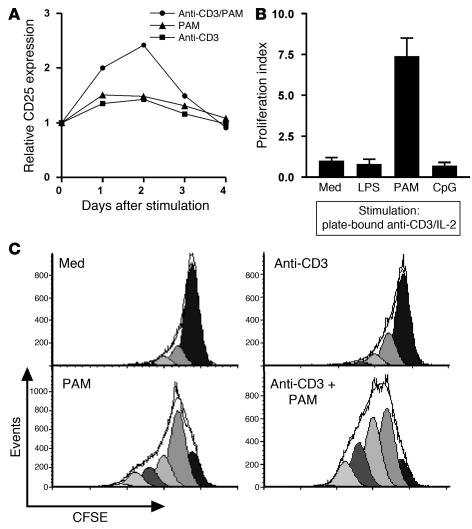
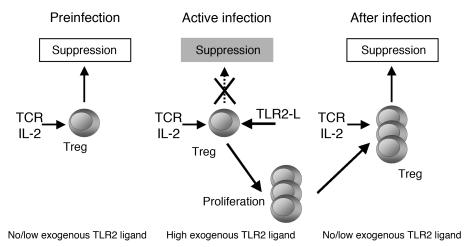
Tregs play a central role in the suppression of immune reactions and prevention of autoimmune responses harmful to the host. During acute infection, however, Tregs might hinder effector T cell activity directed toward the elimination of the pathogenic challenge. Pathogen recognition receptors from the TLR family expressed by innate immune cells are crucial for the generation of effective immunity. We have recently shown the CD4CD25 Treg subset in TLR2 mice to be significantly reduced in number compared with WT littermate control mice, indicating a link between Tregs and TLR2. Here, we report that the TLR2 ligand Pam3Cys, but not LPS (TLR4) or CpG (TLR9), directly acts on purified Tregs in a MyD88-dependent fashion. Moreover, when combined with TCR stimulation, TLR2 triggering augmented Treg proliferation in vitro and in vivo and resulted in a temporal loss of the suppressive Treg phenotype in vitro by directly affecting Tregs. Importantly, WT Tregs adoptively transferred into TLR2 mice were neutralized by systemic administration of TLR2 ligand during the acute phase of a Candida albicans infection, resulting in a 100-fold reduced C. albicans outgrowth. This demonstrates that in vivo TLR2 also controls the function of Tregs and establishes a direct link between TLRs and the control of immune responses through Tregs.


Figures

Figure 1
Figure 1
Decreased CD4+CD25+ T cell numbers in MyD88-deficient mice. Blood and spleens from MyD88–/– mice and their littermate MyD88+/+ controls (4 per group) were analyzed by flow cytometry for relative CD4+CD25+ T cell numbers. Data indicate mean percentage of CD4+CD25+ T cell numbers of total CD4+ T cells ± SEM. Representative results of 3 experiments are shown. *P < 0.02 with WT controls.
Figure 2
Figure 2
In vitro TLR2 signaling results in Treg proliferation. Below each graph, the specific T cell stimulation is indicated. (A) Proliferation of Tregs in the presence of irradiated APCs, anti-CD3, and TLR ligands. Irradiated APCs and anti-CD3 (medium control [med]) were cultured for 3 days with or without 104 purified Tregs and with or without the addition of TLR ligands: purified LPS (TLR4), PAM (TLR2), or CpG (TLR9). Values indicate average counts per minute of triplicate wells ± SD. *P < 0.02 for medium control compared with TLR ligands. (B and C) CD25 expression by purified CD4+CD25+/– T cells. (B) Tregs were cultured for 3 days in the presence of irradiated APCs and anti-CD3 (medium control) or with addition of purified LPS, PAM, or CpG. CD25 expression was measured by flow cytometry. Values indicate average MFI of anti-CD25–FITC–stained CD4+ cells of triplicates ± SD. *P < 0.02 for medium control compared with TLR ligands. (C) T cell activation in the absence of APCs. Purified CD4+CD25+ Tregs or CD4+CD25 conventional Th cells were cultured with IL-2 and soluble anti-CD3 (medium control) or with the addition of purified LPS, PAM, or CpG (no APCs present). After 3 days, CD25 expression was measured by flow cytometry. Values indicate average MFI of triplicates ± SD. One representative experiment out of 3 is shown. *P < 0.02 PAM with medium control.
Figure 3
Figure 3
PAM induces CD25 expression through TLR2 signaling. Below each graph, the specific T cell stimulation is indicated. (A) TLR2 and MyD88 expression is required for PAM-mediated increase of CD25 expression. Purified WT, TLR2–/–, and MyD88–/– CD4+CD25+ T cells were cultured for 3 days with anti-CD3, IL-2 (medium control), or with the addition of PAM. Subsequently, the cells were harvested and CD25 expression was analyzed by flow cytometry. Values indicate average MFI from triplicate wells ± SD. *P < 0.02 with medium control. A representative result of 3 experiments is shown. (B) High numbers of WT APCs are required to increase CD25 expression on TLR2–/– Tregs. Purified CD4+CD25+ T cells from TLR2 –/– mice were incubated for 3 days with increasing amounts of WT APCs plus the TLR2 ligand PAM and anti-CD3, and subsequently, CD25 expression was analyzed by flow cytometry. Values indicate average MFI from triplicates ± SD. **P < 0.05 with medium control. (C) Proliferation of CFSE-labeled freshly isolated WT and TLR2–/– Tregs after stimulation with soluble anti-CD3, IL-2, and PAM. After 4 days, proliferation resulting in a decrease of fluorescent signal in the daughter cells was analyzed by flow cytometry and ModFit analysis software. Representative results of 2 experiments are shown.
Figure 4
Figure 4
Phenotype of PAM-expanded Treg. Expression of intrinsic Treg specific markers on PAM-expanded resting (7 days after stimulation with PAM) Tregs was analyzed by flow cytometry and quantitative PCR. (A) The PAM-expanded Tregs expressed the markers CD4, CD25, GITR, CTLA-4, and CD103 (indicated by thick gray, lines; corresponding isotype controls are indicated by thin, black lines). CTLA-4 was detected by standard intracellular staining procedure. (B) Expression (expr.) of Foxp3 (left panel) and TLR2 (right panel) mRNA by resting PAM-expanded Tregs and conventional CD25 T helper cells was determined by quantitative PCR. The quantitative PCR results are indicated as mean relative mRNA expression from 3 replicate measurements (shown as arbitrary units relative to PBGD) ± SD. (C) Expression of Foxp3 (left panel) and TLR2 (right panel) protein determined by flow cytometry on resting PAM-expanded T cells (Tregs, gray lines; conventional T helper cells, black lines) as well as freshly isolated T cells (CD4+CD25+ Tregs, gray lines; CD4+CD25 Th cells, black lines). Corresponding isotype controls are indicated by the dotted lines. Representative results from 2 experiments are shown.
Figure 5
Figure 5
Proliferation of PAM-expanded Tregs. (A) TLR2 and TCR signals cooperate to increase CD25 expression on Tregs. Tregs were incubated with either PAM, anti-CD3, or a combination of both in IL-2–supplemented medium. CD25 expression was analyzed daily by flow cytometry and indicated as MFI relative to the medium control. (B) Proliferation of Tregs is induced by TLR2 signaling. PAM-cultured Tregs were stimulated on anti-CD3–coated plates with IL-2 (medium control) or with addition of the indicated TLR ligands. After 3 days, proliferation was measured by [3H]thymidine incorporation and shown as average cpm of triplicates relative to medium control ± SD. (C) Proliferation of CFSE-labeled PAM-expanded Tregs. The labeled Tregs were cultured for 3 days in the presence of IL-2–supplemented medium or with the indicated stimulus (PAM and/or anti-CD3). Proliferation resulting in a decrease of fluorescent signal in the daughter cells was monitored by flow cytometry and (since in vitro–cultured T cell lines display a more broad signal after CFSE labeling compared with freshly isolated T cells) analyzed using ModFit software. Representative results from 3 experiments are shown.
Figure 6
Figure 6
PAM-expanded Tregs remain suppressive. (A) In vitro suppression assay. PAM-expanded Tregs or control conventional Th cells (0.5 × 10⁴) were rested for at least 5 days in the absence of TLR ligands and subsequently cocultured for 3 days with 104 fresh naive CD4+ T cells, irradiated APCs, and anti-CD3. After 3 days, proliferation was measured and indicated as average cpm from triplicates ± SD. Representative results from 3 experiments are shown. (B) Comparison of suppressive capacity of freshly isolated WT and TLR2–/– Tregs with PAM-expanded Tregs. Fresh naive CD4+ Th-cells (2 × 10⁴) were cocultured with titrated numbers of Tregs. After 3 days, proliferation was measured by [3H]thymidine incorporation. Relative suppression was calculated with proliferation in the absence of Tregs (fresh CD4+ Th cells only) set at 0 and proliferation at the Treg/Th ratio of 1 at 100%. Suppression/proliferation was measured from the average cpm in triplicate wells.
Figure 7
Figure 7
TLR2 controls Treg suppressor function in vitro. (A) To analyze the direct effects of TLR2 triggering on Treg suppressor function in vitro, 104 TLR2–/– conventional T cells (Th) and 0.5 × 10⁴ freshly isolated WT CD4+CD25+ Tregs were (co)cultured for 3 days. Soluble anti-CD3 and irradiated TLR2–/– APCs were used to stimulate the T cells, ensuring that TLR2 was solely expressed by Tregs. If indicated, PAM was added at the start of the coculture. Data indicate average proliferation from triplicates ± SD. *P < 0.05. (B) CFSE-labeled TLR2–/– Th (105) were cocultured for 4 days with 0.5 × 10⁵ WT Tregs as described in A. CFSE fluorescence intensity was measured by flow cytometry. Analysis was performed on all the CFSE+ cells, using an exclusionary gate for the Treg subset (CFSE-negative CD25high). The percentage of cells that divided more than 3 times is indicated. Representative results from 2 independent experiments are shown. Stim, stimulation.
Figure 8
Figure 8
TLR2 controls Treg suppressor function in vivo. (A) TLR2 and TCR triggering cooperate to induce Treg expansion in vivo. TLR2–/– mice were reconstituted with 2 × 10⁶ freshly isolated and CFSE-labeled OT-II–transgenic Tregs (TCR of OT-II transgenic T cells is Vα2 and specific for the OVA-peptide presented in I-Ab). The reconstituted mice were subsequently challenged i.p. with either PAM (20 μg/mouse) or OVA-peptide [OVA-pep] (10 μg/mouse) alone or with the combination of PAM and OVA-peptide. After 4 days, splenocytes were isolated and analyzed by flow cytometry for CFSE-fluorescent signal of the infused cells. The cells shown are gated for the CD4+, Vα2+, CFSE+ cells, and propidium iodide–positive (death) cells were excluded from the analysis. The value indicates the percentage of cells within the proliferative fraction (>1 division). (B and C) TLR2 triggering abrogates Treg-mediated suppression of anti–C. albicans immunity in vivo. TLR2–/– mice (5 per group) were reconstituted with 4 × 10⁶ WT PAM–expanded Tregs (B) or conventional Th cells (C) and challenged i.v. with 105 live C. albicans cells 1 day later (day 0). If indicated, mice received an i.p. injection of 100 μl saline (controls) or 20 μg PAM/100 μl saline on days –1, 1, 3, and 5. SEVEN days after the challenge, C. albicans outgrowth (CFU/g tissue ± SEM) from kidneys was monitored. (D) Ex vivo IFN-γ production (± SEM) by C. albicans–stimulated splenocytes was measured as described in Methods. Representative results of 2 independent experiments are shown. *P < 0.05 with TLR2–/– control.
Figure 9
Figure 9
Model of TLR2-mediated control of Treg function. In a preinfection setting, Treg function is mainly regulated by TCR stimulation and IL-2. During an acute infection, pathogen-derived TLR2 ligands promote proliferation of Tregs paralleled by temporarily abrogated suppression. As a result, Tregs do not suppress the ongoing immune response. Once the pathogen is cleared by the immune system, the source of TLR2 ligands is no longer present, and Tregs will regain their suppressive capabilities, thus contributing to the balance between tolerance and immunity.

References

    1. Sakaguchi S. Naturally arising CD4+ regulatory T cells for immunologic self-tolerance and negative control of immune responses. Annu. Rev. Immunol. 2004;22:531–562. - PubMed
    1. Shevach EM. CD4+ CD25+ suppressor T cells: more questions than answers. Nat. Rev. Immunol. 2002;2:389–400. - PubMed
    1. Thornton AM, Shevach EM. Suppressor effector function of CD4+CD25+ immunoregulatory T cells is antigen nonspecific. J. Immunol. 2000;164:183–190. - PubMed
    1. Piccirillo CA, Shevach EM. Cutting edge: control of CD8+ T cell activation by CD4+CD25+ immunoregulatory cells. J. Immunol. 2001;167:1137–1140. - PubMed
    1. Sakaguchi S, Sakaguchi N, Asano M, Itoh M, Toda M. Immunologic self-tolerance maintained by activated T cells expressing IL-2 receptor alpha-chains (CD25). Breakdown of a single mechanism of self-tolerance causes various autoimmune diseases. J. Immunol. 1995;155:1151–1164. - PubMed

Publication types

MeSH terms