. 2006 Jan 20:3:1.
doi: 10.1186/1742-2094-3-1.

Serum antibodies from Parkinson's disease patients react with neuronal membrane proteins from a mouse dopaminergic cell line and affect its dopamine expression

Affiliations

Serum antibodies from Parkinson's disease patients react with neuronal membrane proteins from a mouse dopaminergic cell line and affect its dopamine expression

Victor C Huber et al. J Neuroinflammation. .

Abstract

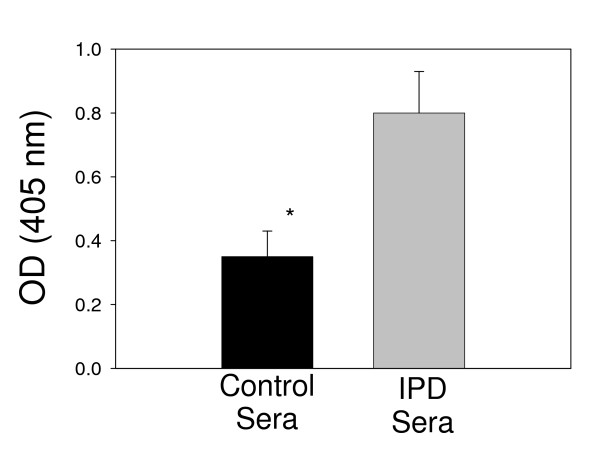
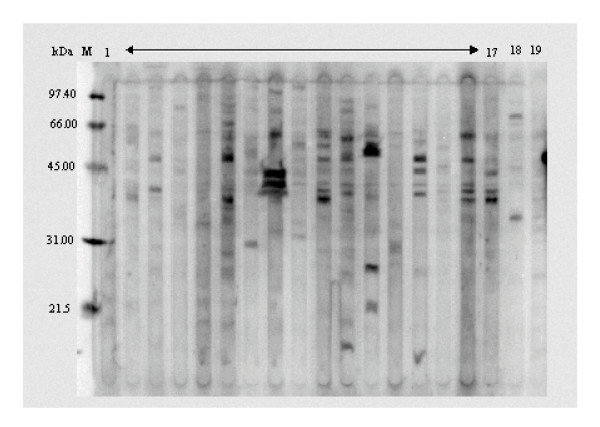
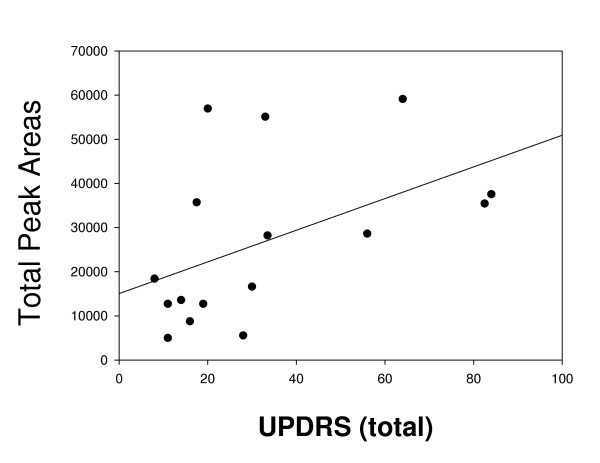
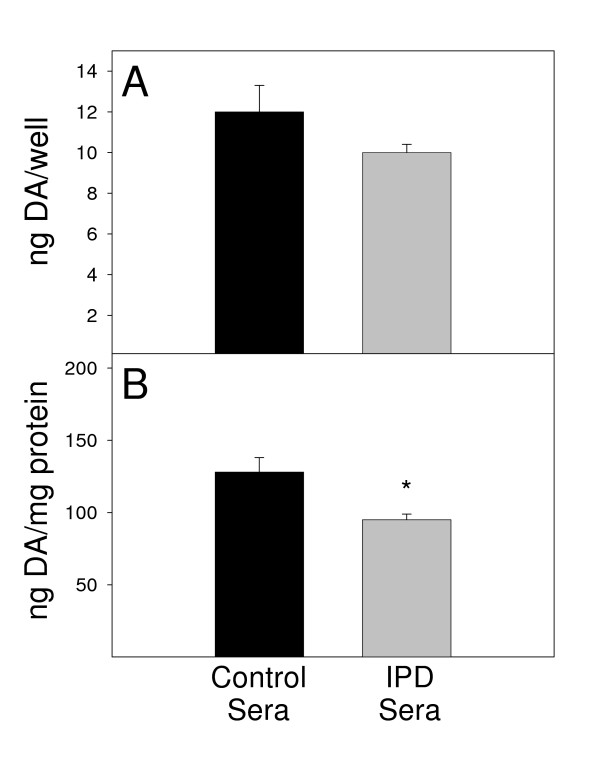
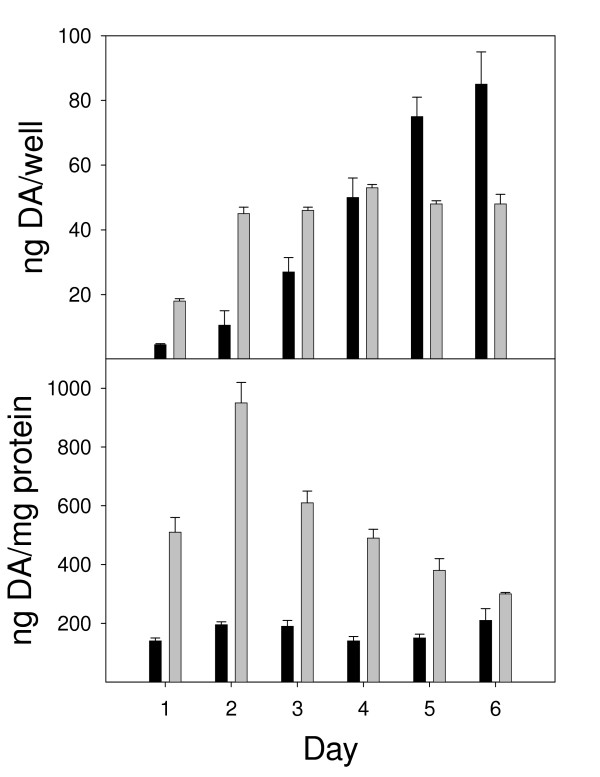
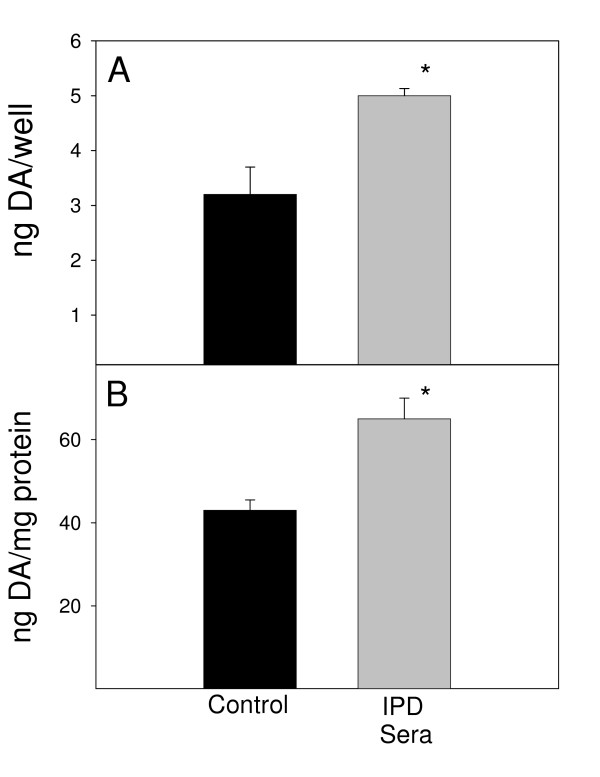
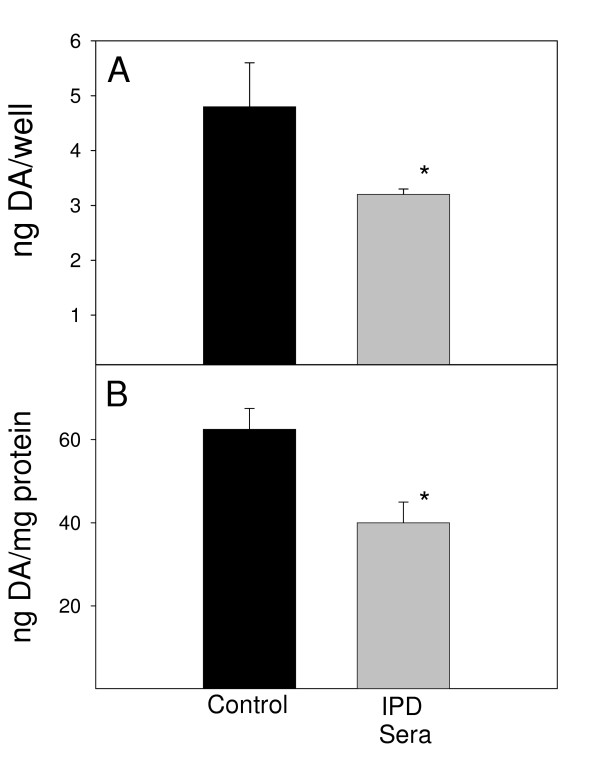
Evidence exists suggesting that the immune system may contribute to the severity of idiopathic Parkinson's disease (IPD). The data presented here demonstrates that antibodies in the sera of patients with IPD have increased binding affinity to dopaminergic (DA) neuronal (MN9D cell line) membrane antigens in comparison to antibodies in sera from healthy controls. In general, the degree of antibody reactivity to these antigens of the mouse MN9D cell line appears to correlate well with the disease severity of the IPD patients contributing sera, based on the total UPDRS scores. Surprisingly, the sera from IPD patients enhanced the DA content of MN9D cells differentiated with n-butyrate; the n-butyrate-differentiated MN9D cells had a greater concentration of DA (DA/mg total protein) than undifferentiated MN9D cells, especially early in culture. Although the IPD sera did not directly harm MN9D cellular viability or DA production, in the presence of the N9 microglial cell line, the amount of DA present in cultures of untreated or n-butyrate-treated MN9D cells was lowered by the IPD sera. The results suggest the involvement of antibodies in the decline of dopamine production and, thus, the potential of immune system participation in IPD.


Figures

Figure 1
Figure 1
ELISA reactivity of human sera with membrane proteins isolated from MN9D neuronal cells. Black bars represent reactivity of sera from 8 control individuals, and gray bars represent sera from 19 IPD patients. Bars represent the mean and standard error of the mean of five individual experiments. *P < 0.05 compared to control sera.
Figure 2
Figure 2
Western blot reactivity of human sera with membrane proteins isolated from MN9D neuronal cells. In this figure, 17 individual IPD sera (lane 1–17) and 2 control sera (lane 18 & 19) were used to probe the PVDF membrane. Numbers designated to the left of the blot reveal the migration of molecular weight standards in kDa. Data are representative of two individual experiments.
Figure 3
Figure 3
Correlation analysis of clinical score (UPDRS – total) with the sum of the peak areas from the Western analysis (Fig. 2). The r2 value was assessed by linear regression analysis (SigmaPlot 2000) and the significance (p) was calculated by Pearson correlation analysis with SigmaStat (Jandel Corp).
Figure 4
Figure 4
After 72 hr exposure to human sera at 37°C, DA levels were assessed in co-cultures of MN9D neuronal cells (4 × 10⁴ cells/ml) and N9 microglia (2 × 10⁴ cells/ml). Black bars represent DA values upon exposure to 8 control sera and gray bars represent values upon exposure to 19 sera from IPD patients. Results are reported as both (A) ng/well and (B) ng/mg protein. Bars represent the mean and standard error of the mean for four individual experiments. *P < 0.05 compared to control sera.
Figure 5
Figure 5
Time course of DA expression by MN9D neuronal cells after exposure to n-butyrate. Black bars represent untreated cells and gray bars represent cells differentiated in the presence of 1 mM n-butyrate. Results are reported as both (A) ng/well and (B) ng/mg protein. Results represent the data from three individual wells per group. *P < 0.05 compared to untreated cells.
Figure 6
Figure 6
After 72 hr exposure to human sera at 37°C, DA levels were assessed in cultures of n-butyrate-differentiated MN9D neuronal cells (4 × 10⁴ cells/ml). Black bars represent DA values upon exposure to a pool of 8 control sera; gray bars represent values upon exposure to a pool of 19 sera from IPD patients. Results are reported as both (A) ng/well and (B) ng/mg protein. Bars represent the mean and standard error of the mean for three individual wells. *P < 0.05 compared to control sera.
Figure 7
Figure 7
After 72 hr exposure to human sera at 37°C, DA levels were assessed in co-cultures of n-butyrate-differentiated MN9D neuronal cells (4 × 10⁴ cells/ml) and N9 microglia (2 × 10⁴ cells/ml). Black bars represent DA values upon exposure to a pool of 8 control sera; gray bars represent values upon exposure to a pool of 19 sera from IPD patients. Results are reported as both (A) ng/well and (B) ng/mg protein. Bars represent the mean and standard error of the mean for three individual wells. *P < 0.05 compared to control sera.

References

    1. Lang A, Lozano A. Parkinson's disease: First of two parts. N Engl J Med. 1998;339:1044–1053. doi: 10.1056/NEJM199810083391506. - DOI - PubMed
    1. Lang A, Lozano A. Parkinson's disease: Second of two parts. N Engl J Med. 1998;339:1130–1143. doi: 10.1056/NEJM199810153391607. - DOI - PubMed
    1. Beal M. Experimental models of Parkinson's disease. Nat Rev Neurosci. 2001;2:325–334. doi: 10.1038/35072550. - DOI - PubMed
    1. Olanow C, Tatton W. Etiology and pathogenesis of Parkinson's disease. Annu Rev Neurosci. 1999;22:123–144. doi: 10.1146/annurev.neuro.22.1.123. - DOI - PubMed
    1. McInerney-Leo A, Hadley D, Gwinn-Hardy K, Hardy J. Genetic testing in Parkinson's disease. Mov Disord. 2005;20:1–10. doi: 10.1002/mds.20316. - DOI - PubMed

LinkOut - more resources