. 2006 Feb;26(3):863-70.
doi: 10.1128/MCB.26.3.863-870.2006.

Real-time monitoring of chloroplast gene expression by a luciferase reporter: evidence for nuclear regulation of chloroplast circadian period

Affiliations

Real-time monitoring of chloroplast gene expression by a luciferase reporter: evidence for nuclear regulation of chloroplast circadian period

Takuya Matsuo et al. Mol Cell Biol. 2006 Feb.

Abstract

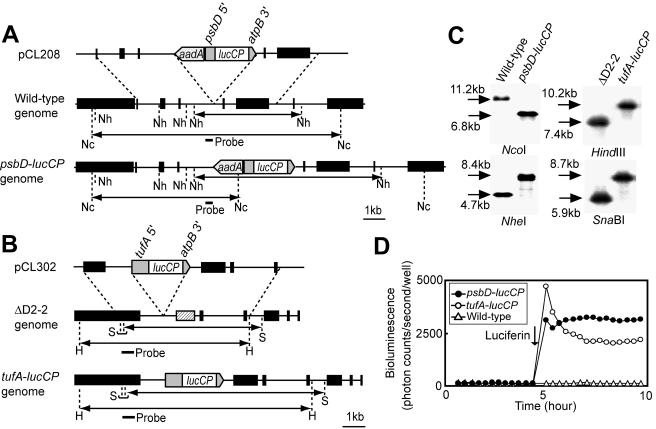
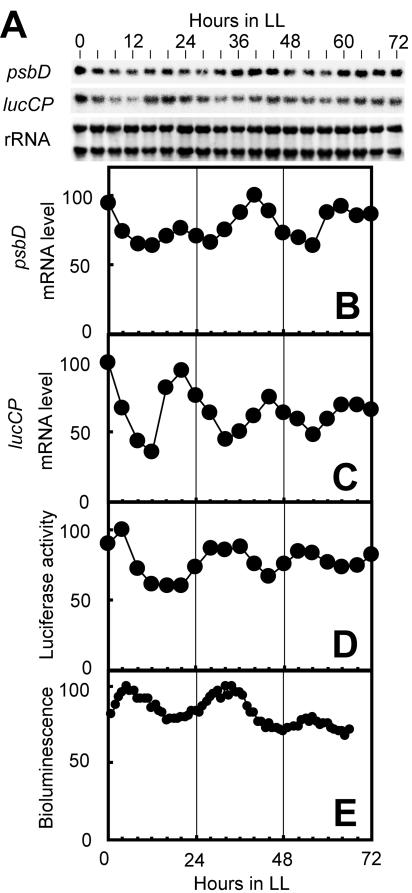
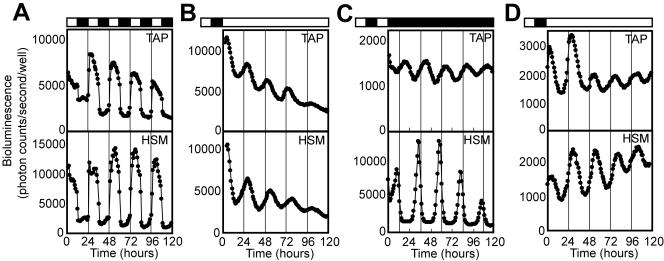
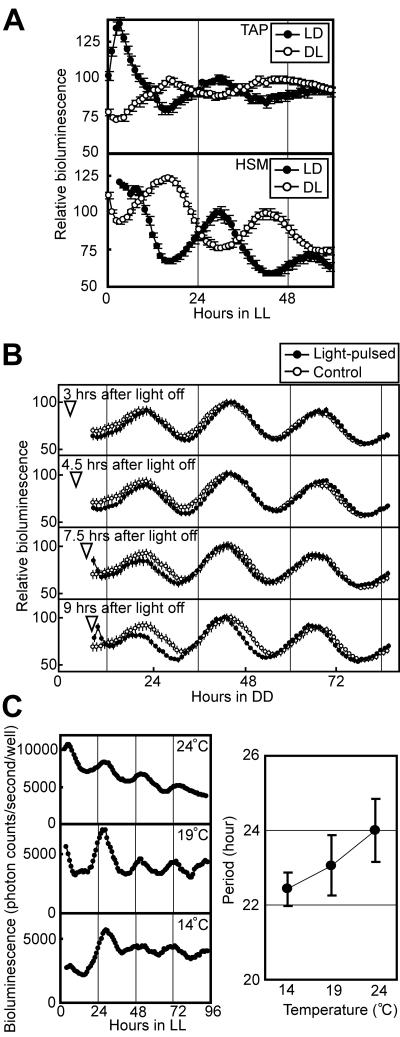
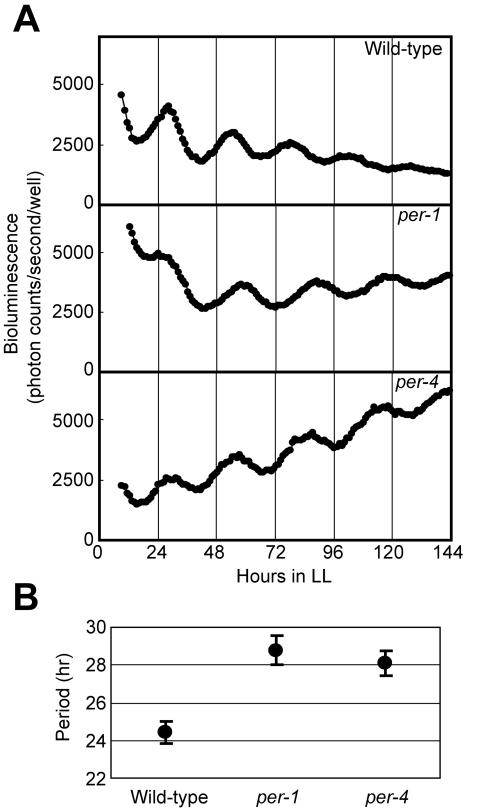
Chloroplast-encoded genes, like nucleus-encoded genes, exhibit circadian expression. How the circadian clock exerts its control over chloroplast gene expression, however, is poorly understood. To facilitate the study of chloroplast circadian gene expression, we developed a codon-optimized firefly luciferase gene for the chloroplast of Chlamydomonas reinhardtii as a real-time bioluminescence reporter and introduced it into the chloroplast genome. The bioluminescence of the reporter strain correlated well with the circadian expression pattern of the introduced gene and satisfied all three criteria for circadian rhythms. Moreover, the period of the rhythm was lengthened in per mutants, which are phototactic rhythm mutants carrying a long-period gene in their nuclear genome. These results demonstrate that chloroplast gene expression rhythm is a bona fide circadian rhythm and that the nucleus-encoded circadian oscillator determines the period length of the chloroplast rhythm. Our reporter strains can serve as a powerful tool not only for analysis of the circadian regulation mechanisms of chloroplast gene expression but also for a genetic approach to the molecular oscillator of the algal circadian clock.


Figures

FIG. 1.
FIG. 1.
Nucleotide sequence of the lucCP coding region. Nucleotides that were changed from those of the original firefly luciferase gene are denoted by black boxes.
FIG. 2.
FIG. 2.
Construction of bioluminescence reporter strains. (A) Schematic representation of the reporter construct and the chloroplast genomes of psbD-lucCP and wild-type strains. psbD 5′ represents the promoter and 5′-UTR of the psbD gene; atpB 3′ represents the 3′-UTR of the atpB gene. The black boxes of the chloroplast genomes denote genes: from left to right, wendy, trnE2, psbH, psbN, psbT, psbB, trnD, and rpoA. The small bar indicates the location of the probe used for Southern blot analysis. The double-headed arrows indicate fragments expected to be detected by Southern blot analysis. Restriction sites: Nc, NcoI; Nh, NheI. (B) Schematic representation of the reporter construct and the chloroplast genomes of tufA-lucCP and ΔD2-2 strains. tufA 5′ represents the promoter and 5′-UTR of the tufA gene. The black boxes denote genes: from left to right, ORF2971, psbD (replaced with the 483-bp repeats [12] in the ΔD2-2 genome [hatched box]), psaA exon 2, psbJ, atpI, psaJ, and rps12. Restriction sites: H, HindIII; S, SnaBI. (C) Southern blot analysis of genomic DNAs. Genomic DNAs digested with the restriction enzyme were hybridized with the probes indicated in panels A and B. Sizes of detected bands are indicated. (D) Representative traces of bioluminescence from the wild-type and reporter strains. One hundred microliters of mid-log-phase cultures grown in TAP medium was transferred into individual wells of a 96-well microtiter plate, and bioluminescence was measured every 20 min with the automated bioluminescence-monitoring apparatus. The arrow indicates when luciferin was added (final concentration, 100 μM).
FIG. 3.
FIG. 3.
Circadian rhythms of lucCP gene expression and bioluminescence. A continuous culture of the psbD-lucCP strain was synchronized by exposure to 12 h of darkness, and the culture was sampled under LL every 4 h for RNA and protein analysis and every hour for bioluminescence measurement. (A) Northern blot analyses of psbD and lucCP. RNA was stained with methylene blue, and the stained rRNA bands are shown as loading references. (B to E) The graphs show the temporal patterns of the psbD transcript (B), the lucCP transcript (C), luciferase activity determined by an in vitro assay (D), and in vivo bioluminescence (E). The maximum values were adjusted to 100. Similar results were obtained in two independent experiments.
FIG. 4.
FIG. 4.
Real-time monitoring of circadian rhythms in a 96-well plate format. (A to C) Representative bioluminescence rhythms of the psbD-lucCP strain monitored under LD cycles (A), LL (B), and DD (C) at 24°C. (D) Representative bioluminescence rhythms of the tufA-lucCP strain monitored under LL at 24°C. Lighting conditions are indicated above the graphs: White bar, light period; black bar, dark period. The thin vertical lines mark the time of light onset (A) or that of the LD cycle preceding measurement (B to D).
FIG. 5.
FIG. 5.
Phase resetting and temperature compensation of the period length of bioluminescence rhythms. (A) Phase resetting of the bioluminescence rhythm. The bioluminescence rhythm of the psbD- lucCP strain exposed to LD or DL was monitored under LL at 24°C. Data points and bars represent means ± standard deviations of the bioluminescence levels of 12 to 20 replicate samples. For precise phase comparisons, the maximum values of the bioluminescence on the second day were adjusted to 100, and the lower portions of the vertical axes were omitted. (B) Phase shifting of the bioluminescence rhythm. The psbD-lucCP strain on TAP agar was exposed to LD and transferred to DD at 24°C, and then a 15-minute light pulse (30 μmol m−2 s−1) was given at 3, 4.5, 7.5, or 9 h after light off (arrow heads). For phase comparisons, the maximum values on the second day were adjusted to 100, and the traces of the control without a light pulse are shown. (C) Temperature compensation of the bioluminescence rhythm. The bioluminescence rhythm of the psbD-lucCP strain on TAP agar was monitored under LL at three different temperatures. The left panel shows representative rhythms. In the right panel, data points and bars represent means ± standard deviations of the period lengths of the rhythms.
FIG. 6.
FIG. 6.
Bioluminescence rhythms of per mutants. (A) Representative bioluminescence rhythms of the wild-type, per-1, and per-4 strains. The bioluminescence rhythms were monitored under LL at 17°C on HSM agar. (B) Period length of bioluminescence rhythm in per mutants. Data points and bars represent means ± standard deviations.

References

    1. Alberts, B., A. Johnson, J. Lewis, M. Raff, K. Roberts, and P. Walter. 2002. Molecular biology of the cell, 4th ed. Garland Science, New York, N.Y.
    1. Aoki, S., S. Kato, K. Ichikawa, and M. Shimizu. 2004. Circadian expression of the PpLhcb2 gene encoding a major light-harvesting chlorophyll a/b-binding protein in the moss Physcomitrella patens. Plant Cell Physiol. 45:68-76. - PubMed
    1. Bhattacharya, D., and L. Medlin. 1998. Algal phylogeny and the origin of land plants. Plant Physiol. 116:9-15.
    1. Brandes, C., J. D. Plautz, R. Stanewsky, C. F. Jamison, M. Straume, K. V. Wood, S. A. Kay, and J. C. Hall. 1996. Novel features of Drosophila period transcription revealed by real-time luciferase reporting. Neuron 16:687-692. - PubMed
    1. Bruce, V. G. 1970. The biological clock in Chlamydomonas reinhardi. J. Protozool. 17:328-334.

Publication types

LinkOut - more resources