. 2006 Jan 31;103(5):1184-9.
doi: 10.1073/pnas.0510514103. Epub 2006 Jan 23.

Theory of the deuterium NMR of sterol-phospholipid membranes

Affiliations

Theory of the deuterium NMR of sterol-phospholipid membranes

Harden McConnell et al. Proc Natl Acad Sci U S A. .

Abstract

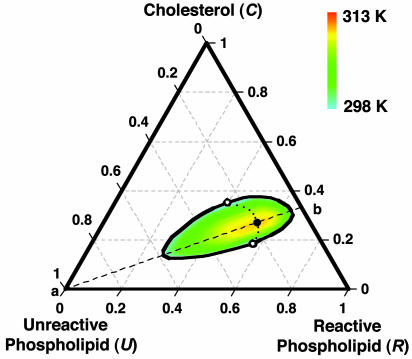
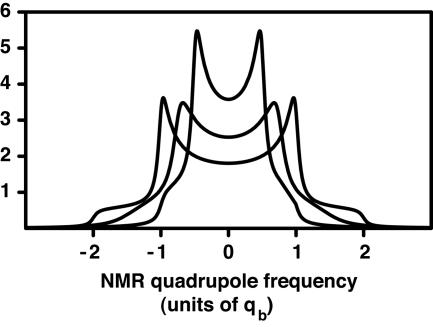
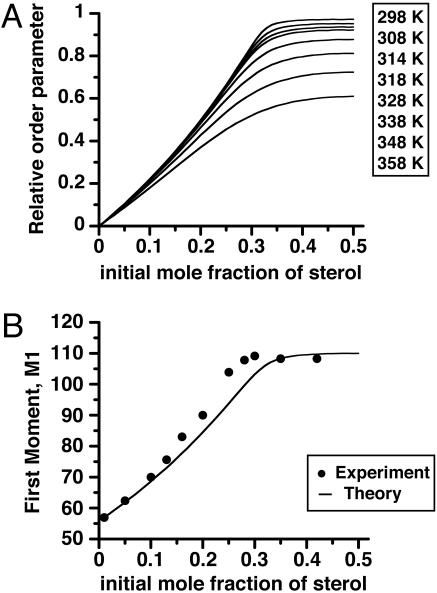
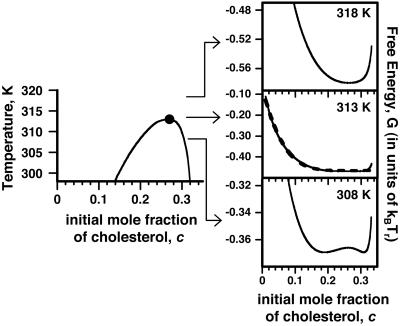
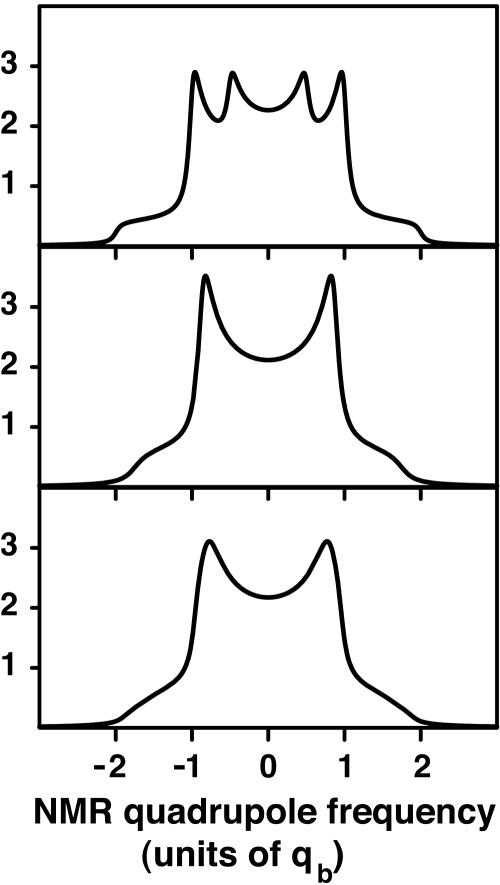
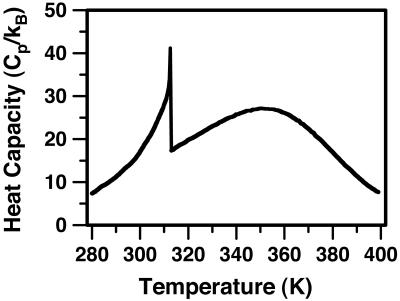
A general theoretical model is described for the NMR spectra of mixtures of sterols and deuterium-labeled phospholipids. In the case of homogeneous membranes, the average quadrupole splittings are determined by equilibria between lipids in cholesterol-phospholipid complexes and lipids not in complexes. Chemical exchange of lipids between those in the free state and those in the complex state affects the deuterium resonance line shapes. The lifetime of a phospholipid molecule in an ergosterol-dipalmitoylphosphatidylcholine complex is estimated to be of the order of 10(-5) s on the basis of the observed line broadenings. In the vicinity of a critical point of a cholesterol-phospholipid mixture, fluctuations in the concentration of complexes also can contribute to the deuterium nuclear resonance line broadening. At the critical point, the temperature derivative of the concentration of complexes is discontinuous. There is a corresponding jump in the calculated heat capacity as well as in the temperature derivative of the deuterium NMR first moment.


Figures

Fig. 1.
Fig. 1.
Calculated phase diagram of a ternary liquid mixture containing C, R, and U. C and R form a 1:2 complex (one C, two R). The black outline and the open circles denote the isothermal binodal curve and critical points at 298 K. The large filled circle denotes the ternary critical point at 313 K, and the smaller filled circles denote critical points at intermediate temperatures. The diagram is meant to simulate the experimental phase diagram of C, DPPC, and DOPC, for which the observed critical temperature is 313 K (16). See text for best-fit parameters. The dashed line (a–b) denotes the stoichiometric axis where the initial mole fractions of C and R are in a 1:2 ratio. The ternary critical point lies on this line. The calculated tie-lines (not shown) lie along the same directions as those determined experimentally (25).
Fig. 2.
Fig. 2.
Calculated deuterium NMR spectra of a hypothetical phospholipid molecule deuterated at a single position on a fatty acid chain. The spectra arise from isotropic distributions of bilayer orientations. Inner, pure phospholipid bilayer (f = 0), quadrupole splitting constant qb = 0.5. Middle, membrane composed of 50% 1:2 complex and 50% phospholipid (f = 0.5). Outer, membrane composed of only 1:2 complex, quadrupole splitting qb = 1.0. The spectrum in the middle results from chemical exchange of phospholipids between the bound and free states, given by the rate parameter p = 0.636. For the E–DPPC mixture, this value of p corresponds to a kinetic off-rate constant of 105 s–1. (For the E–DPPC mixture, qb is ≈25 kHz). The middle spectrum corresponds to rapid exchange, but a residual broadening is apparent because of the finite exchange rate.
Fig. 3.
Fig. 3.
Ordering in sterol–phospholipid binary mixtures. (A) The fraction of phospholipid (DPPC) in complex form (order parameter f) in a binary mixture, calculated using the equilibrium constant derived from the phase diagram for the ternary mixture in Fig. 1. (B) First moments for deuterium NMR spectra of sterol–DPPC mixtures. The data points for E–DPPC mixtures are taken from ref. . The curve is calculated assuming that the first moment is a linear function of f, using the experimental values of M1 at 0.0 and 0.35 mol fraction E for calibration (see text). Note that the data points refer to E–DPPC binary mixtures, whereas the curve is calculated for a C–DPPC binary mixture.
Fig. 4.
Fig. 4.
Critical fluctuations in the ternary mixture, C–DPPC–DOPC. (Left) Pseudobinary mixture phase diagram describing liquid–liquid phase separation for compositions along the 1:2 stoichiometric axis (a tie line) where the mole ratio of C to R is maintained at 1:2 (dashed line a–b in Fig. 1). Parameters used are the same as those used to generate the phase diagram for the ternary mixture in Fig. 1. The ternary critical point at 313 K is indicated by the filled circle. (Right) Calculated free energies for compositions along the stoichiometric axis, 5 K above the critical temperature, at the critical temperature, and 5 K below the critical temperature (note different scales). The dashed curve at the critical temperature is the fit to the power series in Eq. 7.
Fig. 5.
Fig. 5.
Calculated deuterium NMR spectra at the critical point of the ternary C–DPPC–DOPC mixture. (Top) No chemical exchange or composition fluctuations, showing peaks due to complexed and free forms of the phospholipid. (Middle) Calculated spectra with chemical exchange, koff = 105 s–1. (Bottom) Calculated spectra including chemical exchange and composition fluctuations at the critical point. At the critical composition the initial mole fraction of C is 0.27, the initial mole fraction of phospholipid is 0.54, and the fraction of phospholipid in complex form (order parameter) is f = 0.74.
Fig. 6.
Fig. 6.
Calculated heat capacity of the ternary mixture at the critical composition. The heat capacity of the ternary C–DPPC–DOPC mixture was obtained by using Eq. 9 together with ΔH =–19.2 kcal/mol (–32.4 kBTr), the heat of reaction used in calculating the phase diagram in Fig. 1. At the critical temperature, there is a jump in the temperature derivative of the concentration of complexes and a corresponding jump in the heat capacity. A jump in the temperature derivative of the first moment of the deuterium NMR is also calculated at the ternary critical point.

References

    1. Finean, J. B. (1953) Experientia 9, 17–19. - PubMed
    1. Dervichian, D. G. (1958) in Surface Phenomena in Chemistry and Biology, eds. Danielli, J. F., Pankhurst, K. G. A. & Riddiford, A. C. (Pergamon, Oxford), pp. 70–87.
    1. Engelman, D. M. & Rothman, J. E. (1972) J. Biol. Chem. 247, 3694–3697. - PubMed
    1. Hinz, H. & Sturtevant, J. M. (1972) J. Biol. Chem. 247, 3697–3700. - PubMed
    1. Darke, A., Finer, E. G., Flook, A. G. & Phillips, M. C. (1972) J. Mol. Biol. 63, 265–279. - PubMed

Publication types

LinkOut - more resources