

doi: 10.1073/pnas.0510511103.
Epub 2006 Jan 23.
Mitochondrial transfer between cells can rescue aerobic respiration
Affiliations
- PMID: 16432190
- PMCID: PMC1345715
- DOI: 10.1073/pnas.0510511103
Item in Clipboard
Mitochondrial transfer between cells can rescue aerobic respiration
Proc Natl Acad Sci U S A.
.
Abstract
Current theory indicates that mitochondria were obtained 1.5 billion years ago from an ancient prokaryote. The mitochondria provided the capacity for aerobic respiration, the creation of the eukaryotic cell, and eventually complex multicellular organisms. Recent reports have found that mitochondria play essential roles in aging and determining lifespan. A variety of heritable and acquired diseases are linked to mitochondrial dysfunction. We report here that mitochondria are more dynamic than previously considered: mitochondria or mtDNA can move between cells. The active transfer from adult stem cells and somatic cells can rescue aerobic respiration in mammalian cells with nonfunctional mitochondria.
Figures
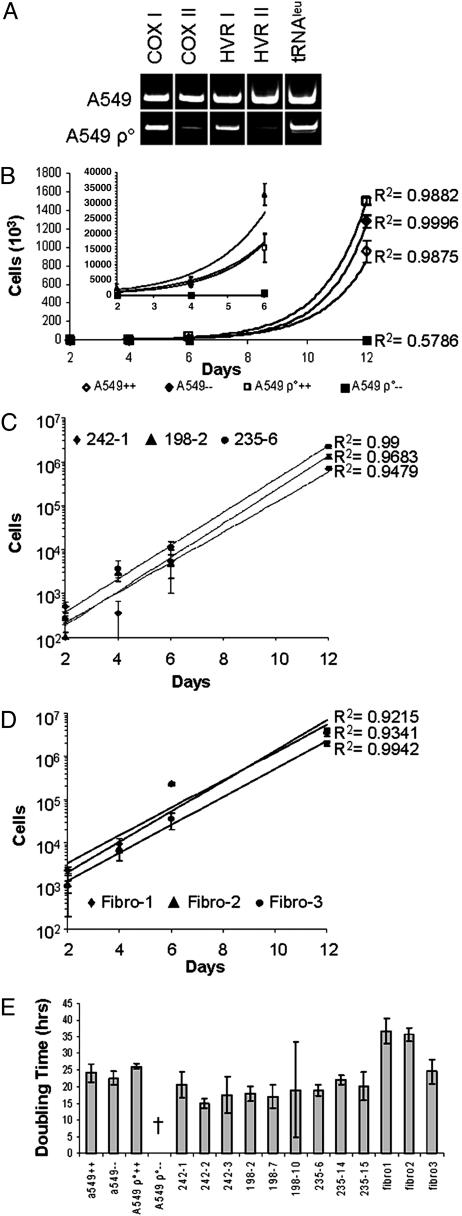
Exponential growth of rescued A549 ρ° clones. (A) PCR analysis of 100 ng of DNA reveals depletion in mtDNA from A549 ρ° cells for COX I and COX II, the D-loop hypervariable regions I and II (HVR I and HVR II), and the leucine transfer RNA (tRNAleu). (B) Growth of the parental A549 cell line and the mtDNA-depleted cell line A549 ρ° in permissive medium containing pyruvate and uridine (⋄, A549++; □, A549 ρ°++) and in restrictive medium lacking supplements (♦, A549–; ▪, A549 ρ°–). (Inset) Expanded scale (0 to 40,000 cells) to indicate growth of cells early in the incubation period. (C) Exponential growth is restored in three representative rescued A549 ρ° clones after transfer of hMSC mitochondria. Each clone is from a different human donor and from a separate coculture experiment (♦, 242-1; ▴, 198-2; •, 235-6). (D) Exponential growth of the rescued A549 ρ° clones derived from fibroblast mitochondria transfer (♦, Fibro-1; ▴, Fibro-2; •, Fibro-3). (E) Doubling times of the parental A549 cell line, A549 ρ° cells, and rescued A549 ρ° clones. (++, growth in permissive medium; ––, growth in restrictive medium). Note that some of the rescued clones have shorter doubling times than the original A549 cells. †, negative value indicating no growth. Error bars represent one standard deviation from the mean (B–D) or the greatest variation of the maximum or minimum doubling times from average between three replicates at day 6 and day 12 (E).
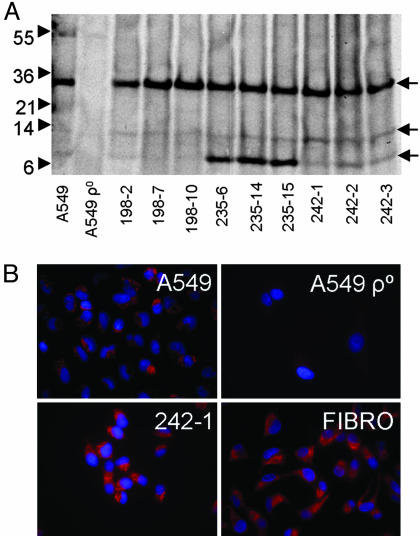
Translation of mitochondrial proteins in rescued A549 ρ° clones. (A) Metabolic labeling of A549 cells, A549 ρ° cells, and rescued A549 ρ° clones was for 5 h with [35S]methionine in methionine-free medium in the presence of emetine to inhibit translation of proteins encoded in the nucleus. Mitochondria were isolated by differential centrifugation, and 10 μg of mitochondria protein was analyzed per sample. A549 ρ° cells did not translate mitochondria proteins, whereas the rescued A549 ρ° clones translate proteins of similar molecular weights to those produced by the parental cell line (arrows). Note that the clones derived from mitochondria transfer from donor 235 have higher levels of an ≈8-kDa protein relative to the parental cell line. (B) Immunocytochemistry of COX II indicating the presence and correct localization of COX II in rescued clones. FIBRO, fibroblast.
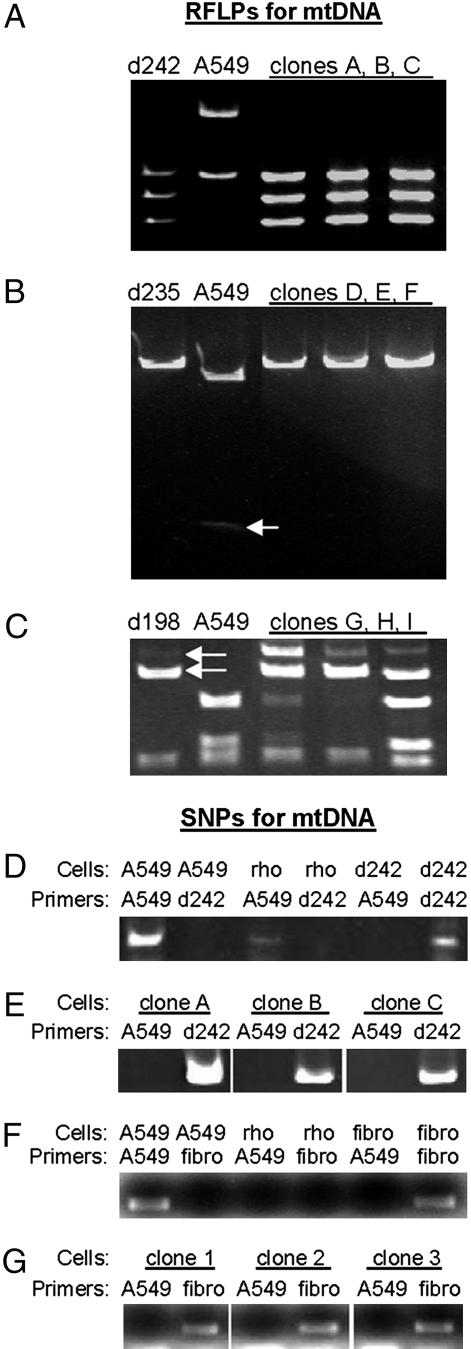
Assays for RFLPs and SNPs for mitochondria transfer from hMSCs and fibroblasts. (A) HpyCH4V restriction enzyme digestion of the PCR products of the hypervariable region I PCR product (donor 242). (B) ApaLI restriction enzyme digestion of PCR products of the hypervariable region II PCR product (donor 235). Arrow, faint second band in digestion of A549 cells that is not present in digestion products from d235 or rescued clones D, E, and F. (C) BfaI restriction enzyme digestion of PCR products of the COX I PCR product (donor 198). In one coculture experiment, some clones contained mtDNA derived from both donor and target cells, implying persistence of the original mtDNA. Arrows, two top bands indicate presence of d198 mtDNA in rescued clones G, H, and I. (D and E) SNP-PCR assays to identify A549-derived mitochondria and hMSC donor-derived mitochondria in rescued clones. Note that clones A, B, and C are the same as those analyzed by in A. (F and G) SNP-PCR assays to identify A549-derived mitochondria and fibroblast (fibro) donor-derived mitochondria in rescued clones. D is the control for E; F is the control for G.
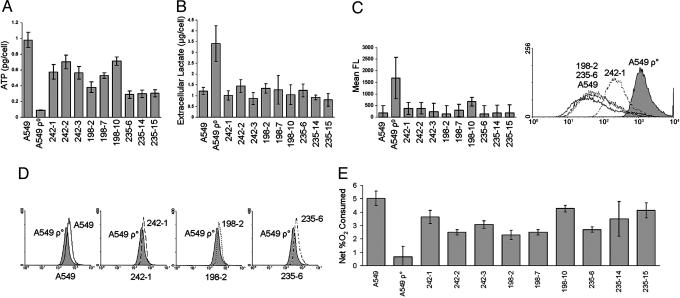
Recovery of mitochondrial function in rescued clones. A549 cells, A549 ρ° cells, and rescued clones were analyzed for mitochondrial function by several assays. (A) Without exception, the rescued clones had significantly increased intracellular ATP compared with A549 ρ° cells. (B) Extracellular lactate was significantly reduced in the rescued clones when normalized for cell number, reaching levels comparable to parental A549 cells. (C) There was a decrease in reactive oxygen species compared with A549 ρ° cells in all of the rescued clones. Values (Left) are relative levels of mean fluorescence (FL) derived from the histogram shown (Right). (D) There was an increase in mitochondrial membrane potential in all rescued clones compared with A549 ρ° cells (242-1, 198-2, and 235-6). (E) Rescued clones consumed almost as much O2 as the parental A549 cells, indicating aerobic respiration. Error bars represent one standard deviation from the mean of three individual cultures (A–D) or three measurements of a single culture (E). Two-tailed Student t tests for A, B, and E indicated P values <0.05.
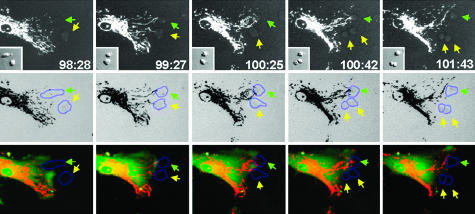
Microscopy of cocultures. hMSCs were transduced with lentiviral vectors encoding the gene for DsRed2 with a mitochondrial localization signal and the gene for hrGFP. They were then added to cocultures with A549 ρ° cells, and time lapse microscopy of cocultures in restrictive medium was recorded. Images were captured every minute for 8 h, starting on the fourth day of coculture. The numbers are time elapsed in hours and min from the initiation of the coculture. (Top) The sequence records an interaction between an hMSC and two A549 ρ° cells in restrictive medium. (Middle) The images are inverse images together with digitally added outlines of the target A549 ρ° cells by differential interference contrast microscopy. (Bottom) The images are composite overlays of red and green fluorescence and digitally added outlines. The hMSC mitochondria localized to two focal areas of contact with the A549 ρ° cells. In the third frame, the hMSC mitochondria became concentrated near the upper A549 ρ° cell. Shortly afterward, the bottom A549 ρ° cell divided, indicating restored aerobic respiration. Green arrow, upper of two A549 ρ° cells; yellow arrow, lower A549 ρ° cell that divided in the fourth frame (Left to Right).
References
-
- Dyall, S. D., Brown, M. T. & Johnson, P. J. (2004) Science 304, 253–257. - PubMed
Publication types
MeSH terms
Substances
Grants and funding
LinkOut - more resources
Full Text Sources
Other Literature Sources
