. 2006 Jan 31;103(5):1627-32.
doi: 10.1073/pnas.0510130103. Epub 2006 Jan 23.

Computer simulations reveal properties of the cell-cell signaling network at the shoot apex in Arabidopsis

Affiliations

Computer simulations reveal properties of the cell-cell signaling network at the shoot apex in Arabidopsis

Pierre Barbier de Reuille et al. Proc Natl Acad Sci U S A. .

Abstract

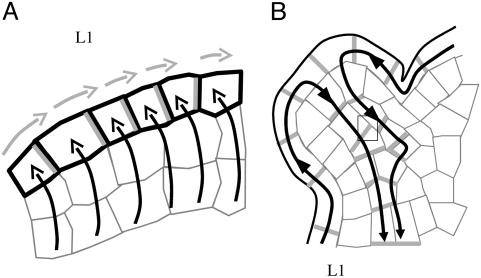
The active transport of the plant hormone auxin plays a major role in the initiation of organs at the shoot apex. Polar localized membrane proteins of the PIN1 family facilitate this transport, and recent observations suggest that auxin maxima created by these proteins are at the basis of organ initiation. This hypothesis is based on the visual, qualitative characterization of the complex distribution patterns of the PIN1 protein in Arabidopsis. To take these analyses further, we investigated the properties of the patterns using computational modeling. The simulations reveal previously undescribed properties of PIN1 distribution. In particular, they suggest an important role for the meristem summit in the distribution of auxin. We confirm these predictions by further experimentation and propose a detailed model for the dynamics of auxin fluxes at the shoot apex.


Figures

Fig. 1.
Fig. 1.
Models for auxin transport in the shoot apical meristem. (A) The putative auxin influx carrier AUX1, represented in black, is homogeneously distributed on the cell membranes of the surface layer of the meristem, whereas the putative auxin efflux carrier PIN1, represented in gray, seems to have a polarized localization. As proposed by ref. , AUX1 would help to concentrate auxin in the surface layer (black arrows), and PIN1 would direct auxin fluxes (gray arrows) within these layers. Note that additional mechanisms responsible for auxin influx into the L1 layer have been proposed (5). (B) In the provascular tissues of young primordia, PIN1 is oriented downward, evacuating auxin from the meristem surface (black arrows) to deeper tissues. Consequently, the primordia act as auxin sinks.
Fig. 2.
Fig. 2.
PIN1 immunolocalization in Arabidopsis shoot apical meristems (6). (A) Global view of an anti-PIN1 immunolabeling on a meristem cross section. PIN1 is localized on the membrane and polarized in most cells. Patterns are complex. Asterisks, young primordia. (Bar, 20 μm.) (B) In the peripheral zone of the meristem, concentric PIN1 orientations around young primordia are observed. The patterns suggest that the cells orient toward a single central cell of the primordium. (C) In boundaries between the meristem and the primordium, cell polarities in opposing directions are observed (arrows). (D) At the meristem summit, PIN1 localization is variable and does not seem to show any particular organization. (Scale bars for B-D,10 μm.)
Fig. 3.
Fig. 3.
From PIN1 immunolabeling to the simulation of auxin fluxes. (A) A transverse section showing PIN labeling. [Reprinted with permission from ref. (Copyright 2005, Elsevier).] The rectangle indicates the detail shown in B. merrysim (see Supporting Text) is used to capture the cell shapes and the PIN1 localization in each cell. (C) All cell vertices (spots) are manually positioned. The vertices of each cell are subsequently grouped. (D) Cells are manually connected to each other if and only if there is a PIN1 labeling on the membrane between them (arrows). The connection is oriented in the way of supposed PIN1-mediated efflux. (E) The result is a network of cell interactions. (F and G) Anti-PIN1 immunolabeling on two successive transverse sections of another meristem. In G, the labeling of the provascular strands at the level of P1 and P2 can be clearly distinguished (arrows). At these positions, called the primordium centers, auxin will be evacuated in the simulations. (H and I) Results of the simulated auxin fluxes in meristems shown in A and F. The position of the primordium centers visible on the original images are marked by green and blue dots. Virtual auxin is injected via the black dots surrounding the meristems. The quantity of virtual auxin per cell is proportional to the red intensity. Auxin accumulates where young primordia are being formed, but also at the meristem summit. Moreover, the auxin maximum at the meristem summit protrudes toward the initium I-1 (gray circle). (Scale bars, 20 μm.)
Fig. 4.
Fig. 4.
Effect of stronger active transport in primordia. (A) Reference simulation with uniform active transport. (B) Simulation with a 10-fold increase of active transport in the cells of the different primordia (colored dots).
Fig. 5.
Fig. 5.
Localization of auxin in Arabidopsis shoot apical meristems. (A-E) Spatial pattern of pDR5::GFP expression in shoot apical meristems under different conditions. (A) Untreated meristem. (B and C) Treatment of a meristem with 10-5 M IAA during 22 h. 10-5 M NPA (auxin transport inhibitor) was added to keep auxin in the meristem (B, t = 0 h; C, t = 22 h). (D and E) Treatment of a meristem with 10-5 M of the synthetic auxin 2,4 D during 22 h (D, t = 0 h; E, t = 22 h). The pDR5::GFP-expressing domain covers a larger part of the periphery after the treatment with IAA-NPA or 2,4 D but the summit of the meristem remains unlabeled. (F and G) Immunolocalization of IAA in shoot apical meristems (16, 17). The presence of labeling is characterized by a purple/brown signal. (F) Cross section of a wild-type meristem; showing labeling at the meristem summit (arrowhead). (G) Longitudinal section of a wild-type meristem also showing labeling at the meristem summit (asterisk). (Scale bars, 20 μm.)
Fig. 6.
Fig. 6.
Quantification of IAA in the central part of the clv3 meristems. (A) Schematic descriptions of wild-type and clv3 meristems illustrating the enlarged central zone in clv3 (CD, central domain). The green area represents the periphery domain (PD) where pDR5::GFP can be expressed. (B and C) Pattern of pDR5::GFP expression in clv3 meristems. (B) Global view of a full projection showing that pDR5 activity is limited to the meristem periphery, with several maxima where the next primordia will be formed. (C) Detail of a meristem. (Bars in A-C, 50 μm.) (D) Results of IAA quantification with GCMS in clv3 meristems. Samples included the young apex (CD + PD + young primordia) or the CD only. For each class, the quantification was performed on four different samples (four dots), each sample containing several meristems. The quantification shows that the central domain of clv3 meristems concentrates significantly (at 1%) more IAA than the overall apex.
Fig. 7.
Fig. 7.
Testing the importance of auxin accumulation at the meristem summit. (A) Simulation of auxin distribution using the standard parameter set (i.e., there are no special instructions for the meristem summit, and auxin is evacuated only via the primordia P-1, P-2, and P-3). (B) Simulation of auxin distribution in the same meristem, but this time the auxin arriving at the summit is immediately degraded. As a result, the maximum at the initium I-1 has disappeared. (C) Simulation of auxin distribution in the same meristem, but this time, the meristem summit was removed. We defined this summit using the auxin accumulation zone. The initium I-1 is still present.
Fig. 8.
Fig. 8.
Auxin fluxes and primordium initiation. (A-C) Auxin pathways inferred from a simulation (see Supporting Text). The color intensity in each cell is proportional to the contribution of this cell to auxin accumulation in the chosen zone (black: no contribution). The different zones are indicated as groups of colored dots. (A) Auxin reaches the summit (gray dots) via corridors between primordia. The most important flux is between P-2 and P-3. I-1 is located at the limit of the summit and the most important flux toward the summit. (B) The initium I-1 (yellow dots) is mainly filled by auxin coming from the periphery. PIN patterns suggest that the center contributes little. (C) All three primordia receive auxin from the periphery. P-1 (red dots) and P-2 (blue dots) also receive some auxin from the center in contrast to P-3 (green dots). (D) Model for the formation of an auxin maximum preceding creation of a primordium. As the distance between P-2 and P-3 increases, more auxin arrives at the meristem center in this sector. Because the center can only absorb a limited amount of auxin, this situation will lead to the formation of an auxin maximum (I-1). Eventually, this maximum will be transformed into a primordium (P-0) where the provascular system behaves as an auxin sink (black dot at the center of the primordium). (Bars, 20 μm.)

References

    1. Vernoux, T., Kronenberger, J., Grandjean, O., Laufs, P. & Traas, J. (2000) Development (Cambridge, U.K.) 127, 5157-5165. - PubMed
    1. Reinhardt, D., Pesce, E.-R., Stieger, P., Mandel, T., Baltensperger, K., Bennett, M., Traas, J., Friml, J. & Kuhlemeier, C. (2003) Nature 426, 255-260. - PubMed
    1. Benkova, E., Michniewicz, M., Sauer, M., Teichmann, T., Seifertova, D., Jurgens, G. & Friml, J. (2003) Cell 115, 591-602. - PubMed
    1. Bennett, M. J., Marchant, A., Green, H. G., May, S. T., Ward, S. P., Millner, P. A., Walker, A. R., Schulz, B. & Feldmann, K. A. (1996) Science 273, 948-950. - PubMed
    1. Kramer, E. M. (2004) Trends Plant Sci. 9, 578-582. - PubMed

Publication types

MeSH terms