. 2006 Jan 31;103(5):1313-8.
doi: 10.1073/pnas.0508658103. Epub 2006 Jan 23.

Real-time imaging of the somite segmentation clock: revelation of unstable oscillators in the individual presomitic mesoderm cells

Affiliations

Real-time imaging of the somite segmentation clock: revelation of unstable oscillators in the individual presomitic mesoderm cells

Yoshito Masamizu et al. Proc Natl Acad Sci U S A. .

Abstract

Notch signaling components such as the basic helix-loop-helix gene Hes1 are cyclically expressed by negative feedback in the presomitic mesoderm (PSM) and constitute the somite segmentation clock. Because Hes1 oscillation occurs in many cell types, this clock may regulate the timing in many biological systems. Although the Hes1 oscillator is stable in the PSM, it damps rapidly in other cells, suggesting that the oscillators in the former and the latter could be intrinsically different. Here, we have established the real-time bioluminescence imaging system of Hes1 expression and found that, although Hes1 oscillation is robust and stable in the PSM, it is unstable in the individual dissociated PSM cells, as in fibroblasts. Thus, the Hes1 oscillators in the individual PSM cells and fibroblasts are intrinsically similar, and these results, together with mathematical simulation, suggest that cell-cell communication is essential not only for synchronization but also for stabilization of cellular oscillators.


Figures

Fig. 1.
Fig. 1.
Characterization of the Hes1 reporters. (a) Structures of the Hes1 reporters. (b) Bioluminescence of C3H10T1/2 fibroblasts stably transfected with Hes1-Ub1-Luc or Hes1-Ub2-Luc was measured in the presence of cycloheximide (20 μM) (n = 3). Luminescence from Hes1-Ub1-Luc and Hes1-Ub2-Luc transfectants was decreased with half lives of ≈10 and 6 min, respectively, but became stabilized in the presence of the proteasome inhibitor MG132 (100 μM). (c) The luciferase activity of Hes1-Ub2-Luc transfectants was measured after serum treatment. Three cycles of oscillation were observed. (d) The luciferase activity and Hes1 mRNA and intron expression of Hes1-Ub1-Luc and Hes1-Ub2-Luc transfectants were measured after serum treatment.
Fig. 2.
Fig. 2.
Bioluminescence imaging of C3H10T1/2 fibroblasts stably transfected with Hes1-Ub2-Luc. (a) Bioluminescence images of individual cells after serum treatment. Images were taken by 10-min exposure and binning of pixels 8 × 8 to increase signal-to-noise ratios. (b) Quantification of bioluminescence of individual cells shown in a.(c) Bioluminescence images of individual cells after serum treatment (see Movie 1). (d) Quantification of bioluminescence of individual cells shown in c.(e) Bioluminescence images of an individual cell 36 h after serum treatment. (f) Quantification of bioluminescence of an individual cell shown in e.
Fig. 3.
Fig. 3.
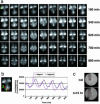
Bioluminescence imaging of the PSM of a Hes1-Ub1-Luc embryo. (a) Bioluminescence images of the PSM were taken by 20-min exposure and binning of pixels 4 × 4 (see Movie 2). Asterisk (top left) indicates S0. Hes1 oscillation was propagated from the caudal end to S0. (b) Quantification of bioluminescence in the PSM. Oscillation was stable in both period and amplitude. Region 1 was always earlier in-phase than region 2. (c) Bright-field exposure. After 15-h incubation, six new somites were segmented (arrow-heads).
Fig. 4.
Fig. 4.
Bioluminescence imaging of the dissected PSM fragments and dissociated PSM cells of Hes1-Ub1-Luc embryos. (a) The caudal part was dissected into three fragments. (b) Quantification of bioluminescence of regions 1 and 2. From the second cycle onward, region 1 was ahead of region 2, thus recovering the phase difference. (c) Quantification of bioluminescence of regions 1 and 3. The phase difference between regions 1 and 3 was not recovered. (d) Bioluminescence images of the individual dissociated PSM cells (see Movie 3). Images were taken by 10-min exposure and binning of pixels 8 × 8 to increase signal-to-noise ratios. (e) Quantification of bioluminescence of individual PSM cells shown in d.
Fig. 5.
Fig. 5.
Mathematical simulations for uncoupled and coupled oscillators. (a) Mathematical simulation for the uncoupled condition. The time course of 128 unstable oscillators is presented (Left). The trough and peak are shown in black and white, respectively. Three representative oscillators (32, 64, 96) are shown (Right). (b) Mathematical simulation of the coupled condition. 1D neighboring interaction makes all of the oscillators stabilized and synchronized (Left). Three representative oscillators (32, 64, 96) are shown (Right).

References

    1. Pourquié, O. (2003) Science 301, 328-330. - PubMed
    1. Bessho, Y. & Kageyama, R. (2003) Curr. Opin. Genet. Dev. 13, 1678-1690. - PubMed
    1. Weinmaster, G. & Kintner, C. (2003) Annu. Rev. Cell Dev. Biol. 19, 367-395. - PubMed
    1. Aulehla, A. & Herrmann, B. G. (2004) Genes Dev. 18, 2060-2067. - PubMed
    1. Giudicelli, F. & Lewis, J. (2004) Curr. Opin. Genet. Dev. 14, 407-414. - PubMed

Publication types

MeSH terms