. 2006 Feb 20;203(2):359-70.
doi: 10.1084/jem.20050648. Epub 2006 Jan 23.

The immune paradox of sarcoidosis and regulatory T cells

Affiliations

The immune paradox of sarcoidosis and regulatory T cells

Makoto Miyara et al. J Exp Med. .

Erratum in

  • J Exp Med. 2006 Feb 20;203(2):477

Abstract

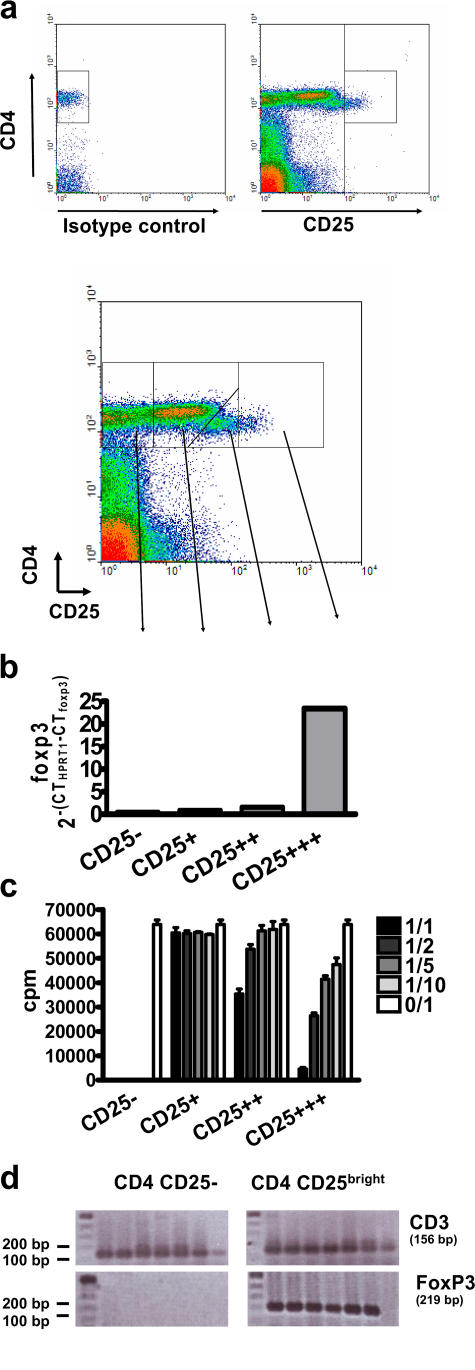
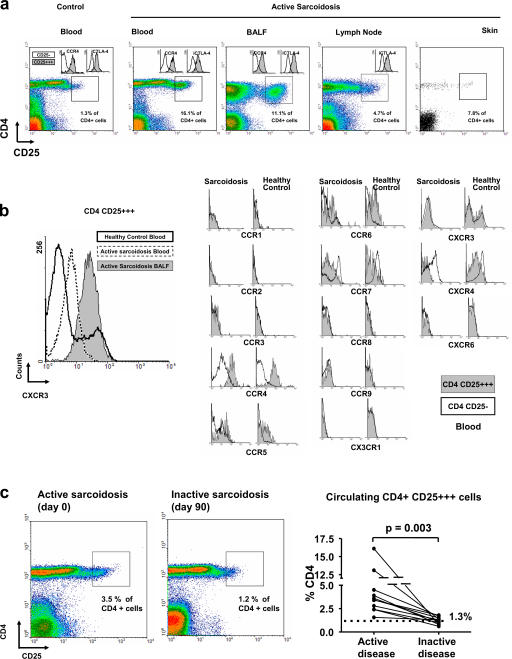
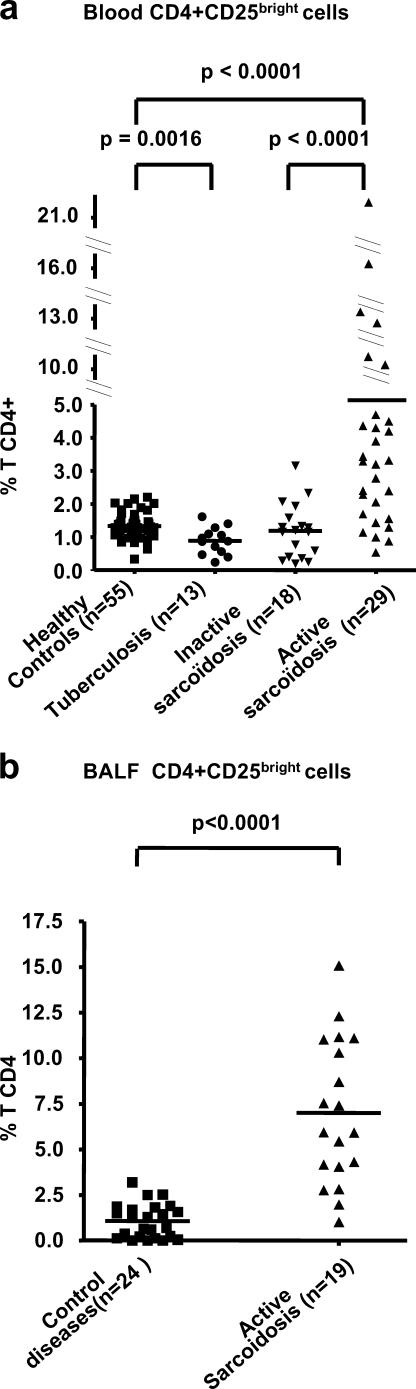
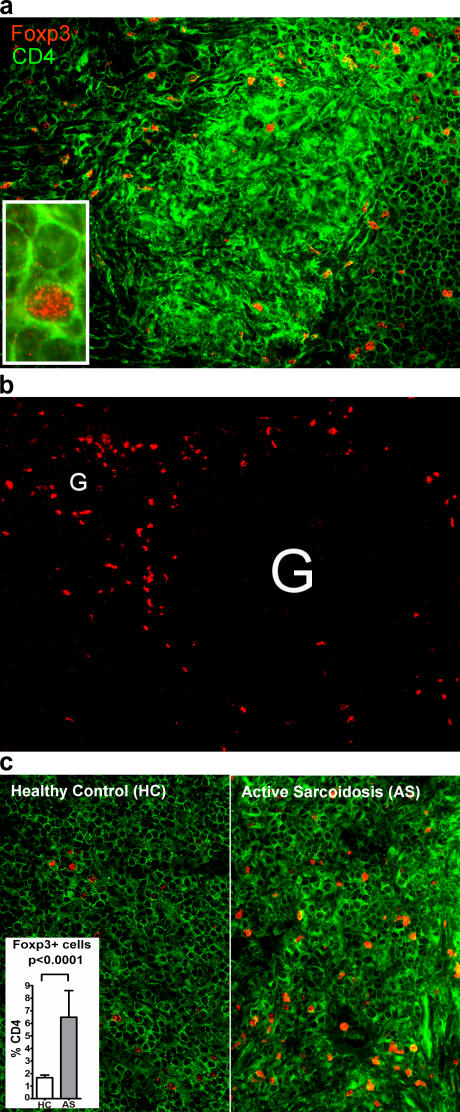
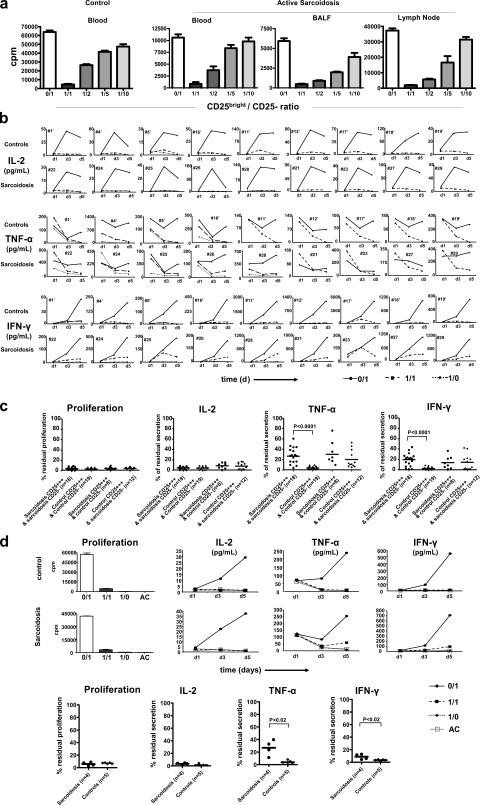
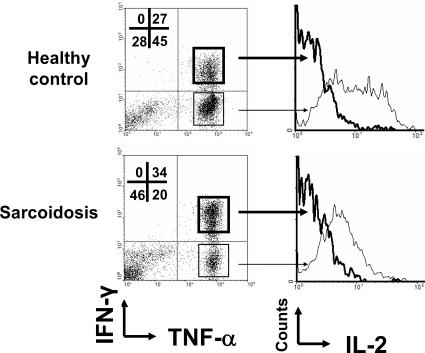
Sarcoidosis is characterized by extensive local inflammation (granuloma, cytokine secretion) associated with anergy (poor response to antigens in vitro and in vivo). We postulated that this paradoxical situation would correspond to a disequilibrium between effector and regulatory T lymphocytes (T reg cells). We show that CD4+CD25(bright)FoxP3+ cells accumulate at the periphery of sarcoid granulomas, in bronchoalveolar lavage fluid, and in peripheral blood of patients with active disease. These cells exhibited powerful antiproliferative activity, yet did not completely inhibit TNF-alpha production. Sarcoidosis is therefore associated with a global T reg cell subset amplification whose activity would be insufficient to control local inflammation. At the same time, peripheral T reg cells exert powerful antiproliferative activity that may account for the state of anergy. Altogether, these findings advance our conceptual understanding of immune regulation in a way that resolves the immune paradox of sarcoidosis and permit us to envisage a profound clinical impact of T reg cell manipulation on immunity.


Figures

Figure 1.
Figure 1.
Isolation and characterization of human natural T reg cells. (a) Red background fluorescence upper level (x axis) is used to define the CD4+CD25 sorting gate (top left). The CD4+CD25+++ (CD25bright) gate was adjusted to contain CD4+ T cells that express CD25 more brightly than CD4CD25+ cells (top right). CD4+CD25+ cells are mainly CD4high, but a tiny fraction is also CD4low. CD4 fluorescence levels were therefore used to define CD4+CD25+ and CD4+CD25++ subsets as shown (bottom). Analysis was restricted to lymphocytes defined according to morphologic parameters. (b) Only CD25bright cells express high levels of FoxP3 among CD4+ T cells. Quantification of relative FoxP3 mRNA levels in CD4+ T cell subsets were sorted as indicated. cDNA samples were subjected to real-time quantitative PCR analyses using primers and an internal fluorescent probe specific for FoxP3 or HPRT. (c) CD25bright cells strongly inhibit the proliferation of autologous CD4+CD25 cells. 1 representative healthy control out of 10 was analyzed for natural T reg cell activity. (d) Detection of FoxP3 transcripts in single cells sorted according to the aforementioned defined parameters. One lane corresponds to one cell. Multiplex PCR was performed on 190 CD4+CD25bright cells and 282 CD4+CD25 cells to detect FoxP3 and CD3δ simultaneously (chosen as a lymphocyte house-keeping gene). As shown, six out of seven representative CD4+CD25bright cells are also FoxP3+ (164 cells out of 190, 86.3%). Only two CD4+CD25 cells were FoxP3+ (0.7%).
Figure 2.
Figure 2.
Phenotype and proportion of CD4+CD25bright T cells in patients and controls. (a) CD4+CD25bright T cells are abundant in blood, BALF, lymph nodes, and skin of patients with active sarcoidosis. Representative cytofluorometric analysis of (from left to right) healthy donor PBMCs, active sarcoidosis (AS) PBMCs, AS BALF lymphocytes, AS lymphocytes isolated from a lymph node (LN), and AS skin lymphocytes is shown. The percentage of CD4+ T cells expressing very high levels of CD25 (CD25bright) is indicated in each case. Gates used to count and sort CD4+CD25bright cells are shown. CD4+CD25 (unshaded histograms) and CD4+CD25bright cells (shaded histograms) were simultaneously analyzed for their expression of membrane CCR4 and intracellular CTLA-4 (iCTLA-4). (b) Comparative expression of CXCR3 on BALF and blood CD4+CD25bright cells. CD4+CD25bright cells were analyzed by flow cytometry for their expression of membrane CXCR3 in one patient with active sarcoidosis and in one healthy control (left). Results of one representative experiment out of five are presented. Expression of other indicated chemokine receptors in a representative control subject and in one AS patient is shown. Flow cytometry analysis of CD4+CD25bright and CD4+CD25 gated lymphocytes is presented. Results of one representative experiment out of two are presented. (c) Contraction of the CD4+CD25bright circulating subset upon resolution of sarcoidosis. One representative longitudinal cytofluorometric analysis (left and middle). Longitudinal monitoring of CD4+CD25bright T cells in 11 patients with resolutive sarcoidosis (right). Percentage of peripheral blood CD4+CD25bright cells was initially measured when sarcoidosis was active and after resolution (mean time interval between two measures: 5 mo ± 2.5). The horizontal dashed line represent the average percentage of CD4+CD25bright T cells in healthy controls (n = 55). Comparisons were made using the Wilcoxon Signed Rank test.
Figure 3.
Figure 3.
Global CD4+CD25bright amplification in active sarcoidosis patients. (a) The percentage of peripheral blood CD4+CD25bright T cells in controls, tuberculosis patients, inactive sarcoidosis patients, and active sarcoidosis patients is shown. (b) The percentage of CD4+CD25bright cells among alveolar lymphocytes in patients with active sarcoidosis and patients with control lung diseases is depicted. The horizontal lines represent mean levels for each group. Comparisons were made using the nonparametric Mann-Whitney U test.
Figure 4.
Figure 4.
TCR diversity analysis of sarcoidosis CD4+CD25bright T cells. Comparative high resolution TCR BV CDR3 Immunoscope analysis of one patient's CD4+CD25 (left) and CD4+CD25bright T cells (right). Both subsets were flow sorted from a lymph node suspension. Nine BV families were studied; the BV profile presented is indicated in each box. The graphs represent the intensity of fluorescence in arbitrary units, as a function of the CDR3 length, in amino acids. Windows are centered on TCRBV DNA run-off products corresponding to transcripts encoding a 10-residue-long CDR3 region.
Figure 5.
Figure 5.
Location of T reg cells within granuloma. (a) FoxP3+ cells (red nuclear staining) are also CD4+ (green cytoplasmic and membrane staining). The diffuse nonspecific staining of collagen fibers in the center of the picture corresponds to a granuloma core found in a sarcoidois patient's lymph node (magnification, 250). Also depicted is a higher magnification view (650×) of adjacent FoxP3+ and FoxP3 CD4+ cells (insert). (b) FoxP3+ T reg cells (red label) encircle granuloma lesions (G) in a patient's lymph node. Representative low magnification (100×) immunohistological analysis of 1 lymph node out of 10 analyzed. (c) FoxP3+CD4+ T reg cells (250×) are randomly distributed and less abundant in control lymph nodes (left, one representative sample out of two) than in lymph nodes from sarcoidosis patients (right, 1 sample out of 10). For statistical analysis, FoxP3+ cells were enumerated in three independent areas in each sample. Comparisons were made using the nonparametric Mann-Whitney U test.
Figure 6.
Figure 6.
Sarcoidosis T reg cells suppress T cell proliferation but not IFN-γ or TNF-α secretion. (a) Control and sarcoidosis CD4+CD25bright cells strongly inhibit proliferation of autologous CD4+CD25 cells. Results are shown of add-back experiments in a representative healthy volunteer (out of 19 tested, see panel b) and in a representative sarcoidosis patient. CD4+CD25 T cells were flow sorted from blood (n = 18), BAL (n = 3) or lymph node (n = 2) and stimulated with anti-CD3 and irradiated allogeneic AC in the presence of different numbers of flow sorted CD4+CD25bright autologous T cells (CD25bright/CD25 ratios are indicated). (b) Time course analysis of cytokine secretion in patients and controls. IL-2, TNF-α, and IFN-γ were measured in supernatants from individual wells that were prepared for the in vitro suppression assays. In indicated patients and controls, cytokine secretion of CD4+CD25bright alone was also studied. Individual analyses are presented. Mean values on day 5 and at a 1/1 ratio of CD25bright/CD25 autologous coculture are as follows: IL-2, 1.47 ± 1.80 pg/ml vs. 1.82 ± 1.53 pg/ml, P = 0.49; TNF-α, 211.9 ± 152.7 pg/ml vs. 183.9 ± 237.4 pg/ml, P < 0.0001; and IFN-γ 1,530.6 ± 1,782 pg/ml vs. 868.5 ± 1,232 pg/ml, P = 0.0003 (patients, n = 18 vs. controls, n = 19). (c) Sarcoidosis T reg cells strongly inhibit autologous CD4+CD25 proliferation and IL-2 secretion, but not IFN-γ or TNF-α. In comparison, control T reg cells strongly inhibit all three cytokines. Sarcoidosis T reg cells do not completely block allogeneic secretion of IFN-γ and TNF-α. Note that control T reg cells do not either completely block patient's TNF-α secretion. Mean percentage of residual proliferation and corresponding mean percentage of residual cytokine secretion of CD4+CD25 cells cocultured with autologous or allogeneic flow sorted T reg cells are presented. (d) Lack of complete TNF-α and IFN-γ suppression is not related to strong allogeneic responses. Add-back experiments presented in a–c have been repeated in the absence of allogeneic AC. Blood CD4+CD25 T cells were instead stimulated with anti-CD3 (0.5 μg/ml) and irradiated autologous AC in the presence or in the absence of CD4+CD25bright T cells (CD25bright/CD25 ratios are indicated). Proliferation of AC alone was also tested (AC). Indicated cytokines were measured in the culture supernatants at indicated times (days). Note that early TNF-α secretion is contributed by AC. One representative experiment in a representative control and a representative sarcoidosis patient (top and middle) are shown. Results from four independent patients and five independent controls are presented (bottom). Comparisons were made using the nonparametric Mann-Whitney U test.
Figure 7.
Figure 7.
Most cells that coproduce TNF-α and IFN-γ do not secrete IL-2. Cytokine production profile of CD4+ T cells after stimulation with PMA. Fresh PBMCs from healthy controls or patients were cultured for 24 h in the presence of PMA. Cells were permeabilized, stained with a cocktail of anti-CD4–PerCP, anti–IL-2–PE, anti–TNF-α–allophycocyanin, and anti–IFN-γ–FITC and analyzed on a FACScalibur flow cytometer. Analysis on gated CD4 cells is presented (left). Proportions of IFN-γ and/or TNF-α–secreting cells are indicated. IL-2 detection in the indicated gated subsets is presented (right). Representative results of independent experiments in three sarcoidosis patients and five healthy controls are shown.

References

    1. Hunninghake, G.W., and R.G. Crystal. 1981. Pulmonary sarcoidosis: a disorder mediated by excess helper T-lymphocyte activity at sites of disease activity. N. Engl. J. Med. 305:429–434. - PubMed
    1. Baumer, I., G. Zissel, M. Schlaak, and J. Muller-Quernheim. 1997. Th1/Th2 cell distribution in pulmonary sarcoidosis. Am. J. Respir. Cell Mol. Biol. 16:171–177. - PubMed
    1. Newman, L.S., C.S. Rose, and L.A. Maier. 1997. Sarcoidosis. N. Engl. J. Med. 336:1224–1234. - PubMed
    1. Baughman, R.P., E.E. Lower, and R.M. du Bois. 2003. Sarcoidosis. Lancet. 361:1111–1118. - PubMed
    1. Lecossier, D., D. Valeyre, A. Loiseau, J. Cadranel, A. Tazi, J.P. Battesti, and A.J. Hance. 1991. Antigen-induced proliferative response of lavage and blood T lymphocytes. Comparison of cells from normal subjects and patients with sarcoidosis. Am. Rev. Respir. Dis. 144:861–868. - PubMed

Publication types

MeSH terms