Comparative Study
. 2006 Mar 1;495(1):53-69.
doi: 10.1002/cne.20849.

Cytoarchitectonic identification and probabilistic mapping of two distinct areas within the anterior ventral bank of the human intraparietal sulcus

Affiliations
Comparative Study

Cytoarchitectonic identification and probabilistic mapping of two distinct areas within the anterior ventral bank of the human intraparietal sulcus

Hi-Jae Choi et al. J Comp Neurol. .

Abstract

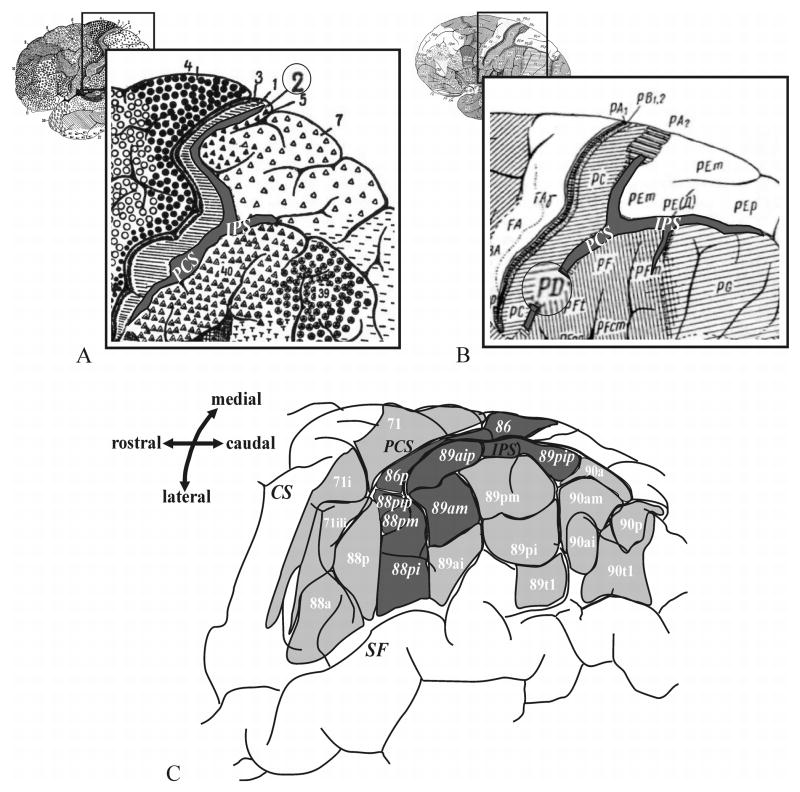
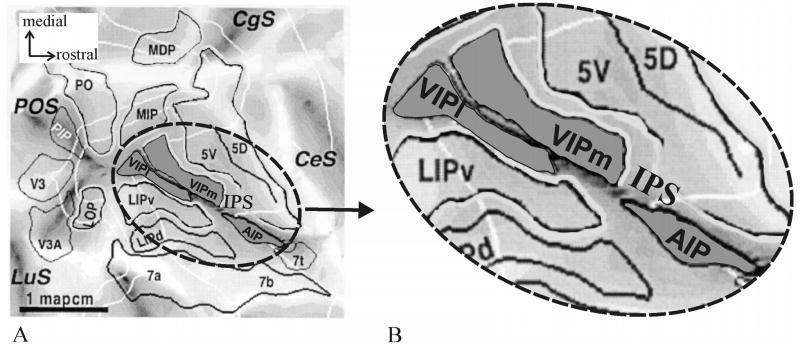
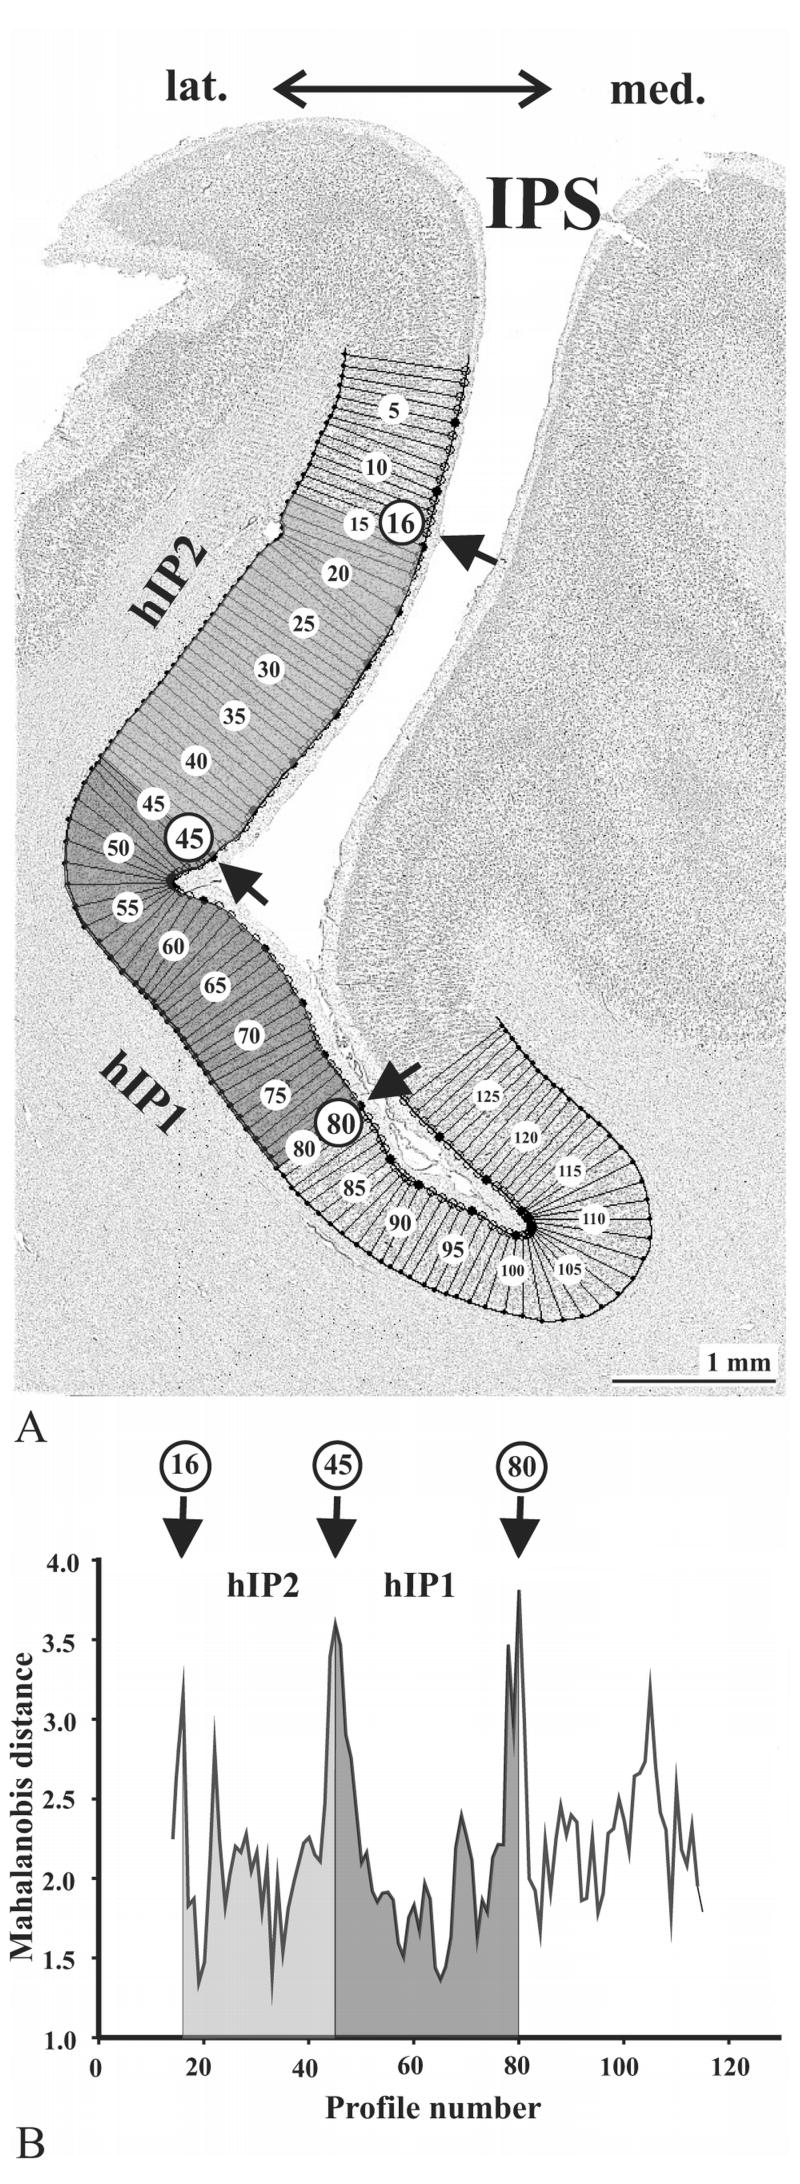
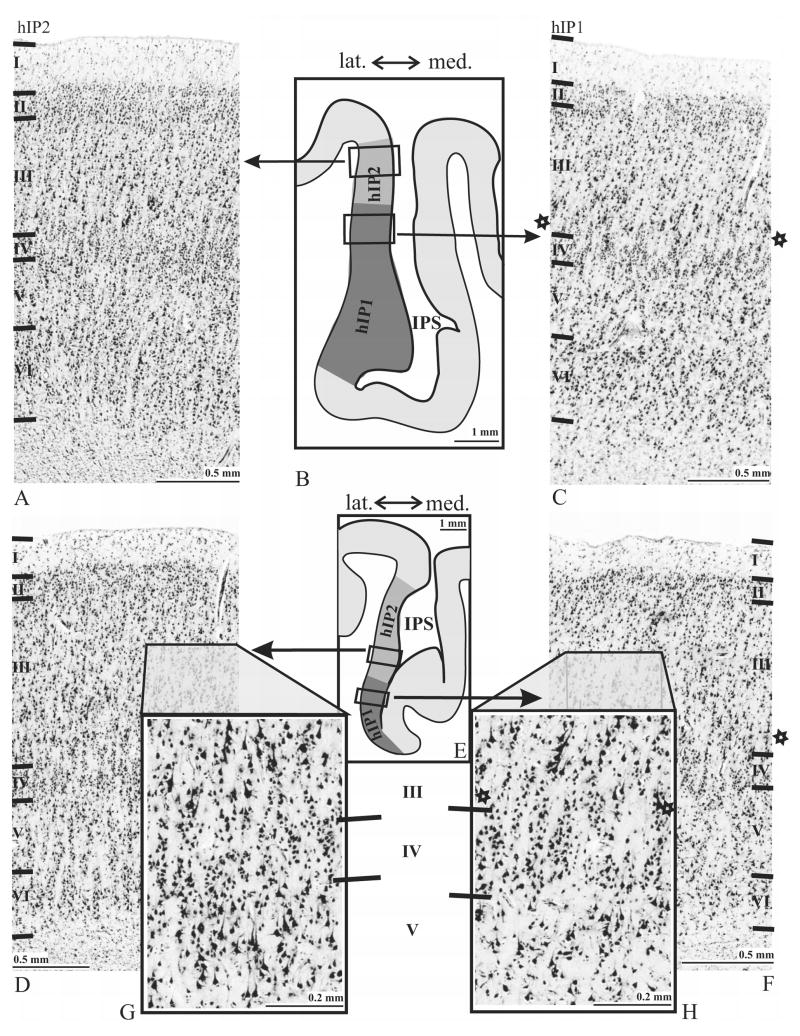
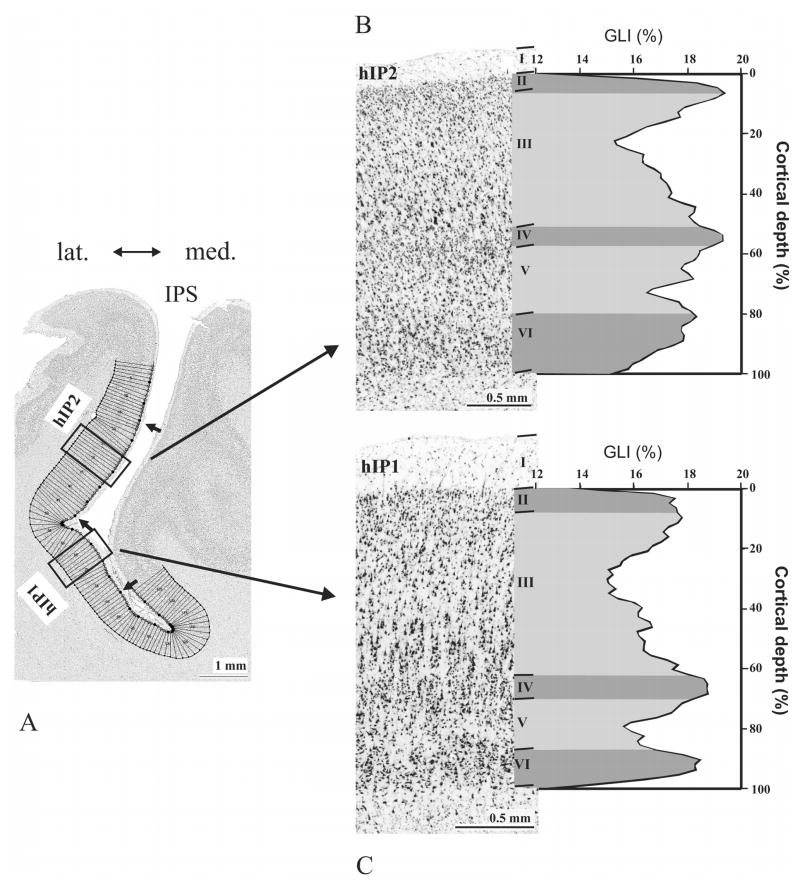
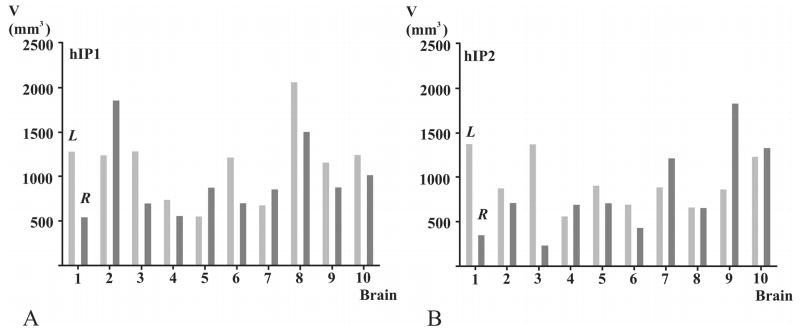
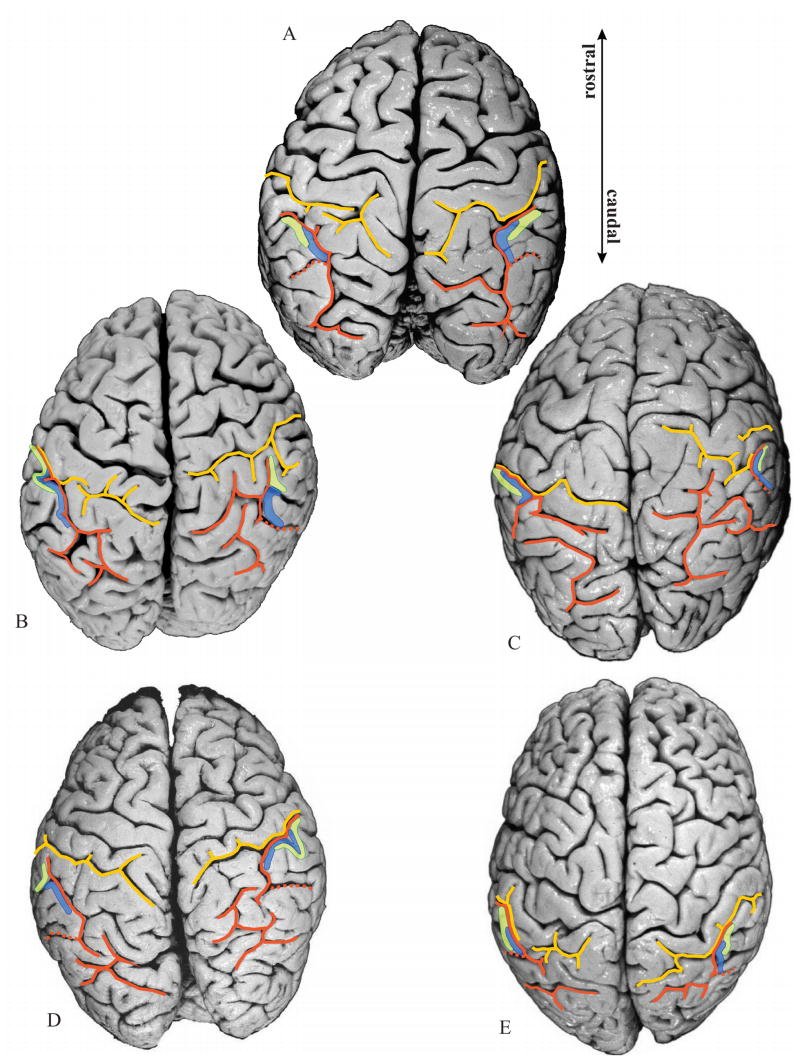
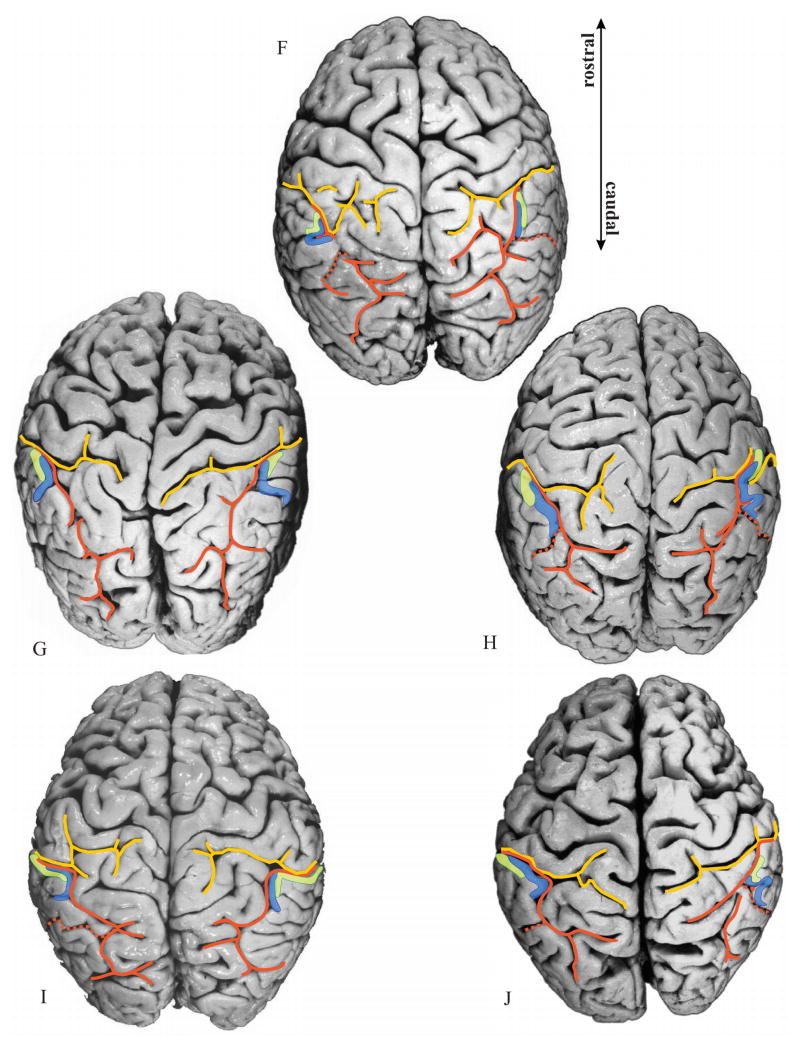
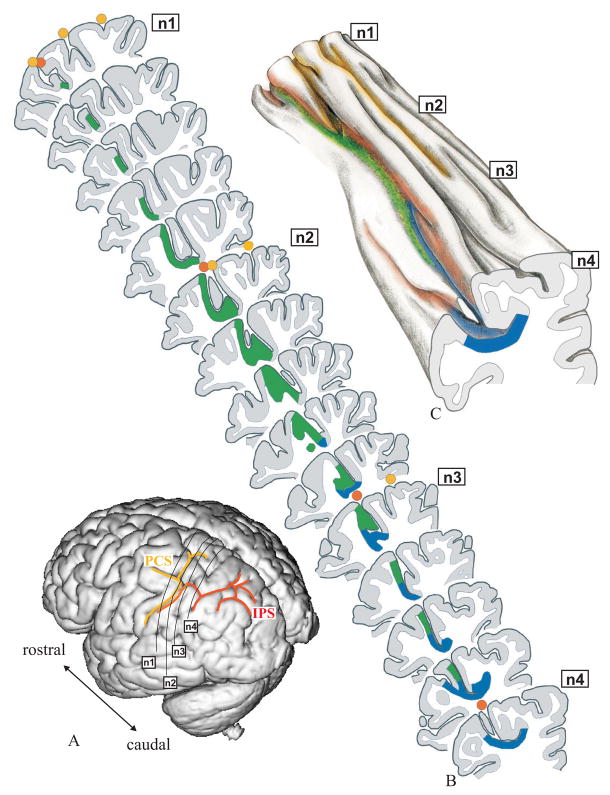
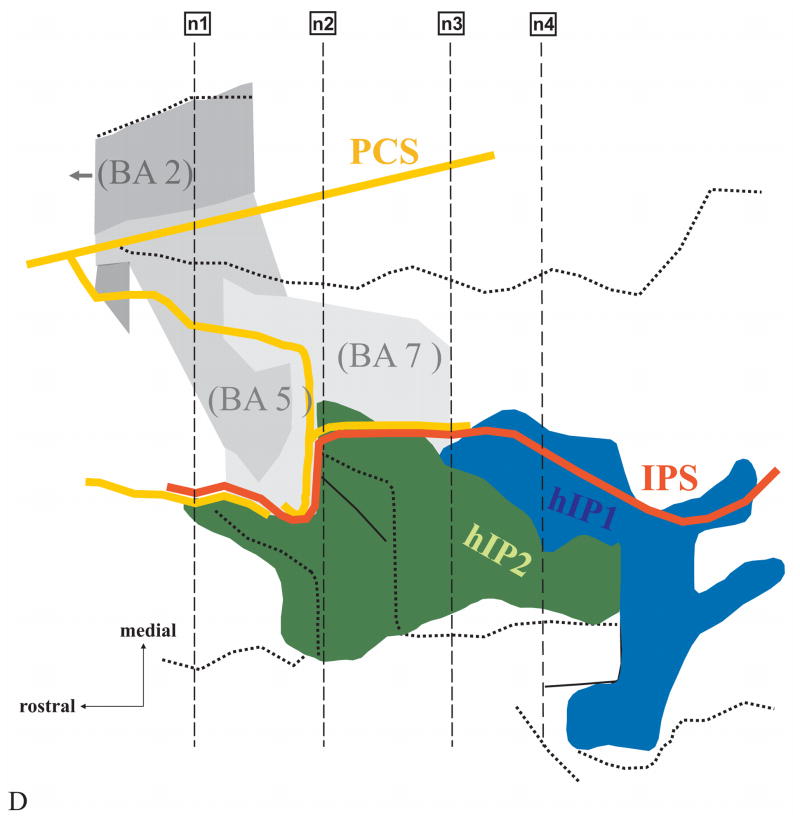
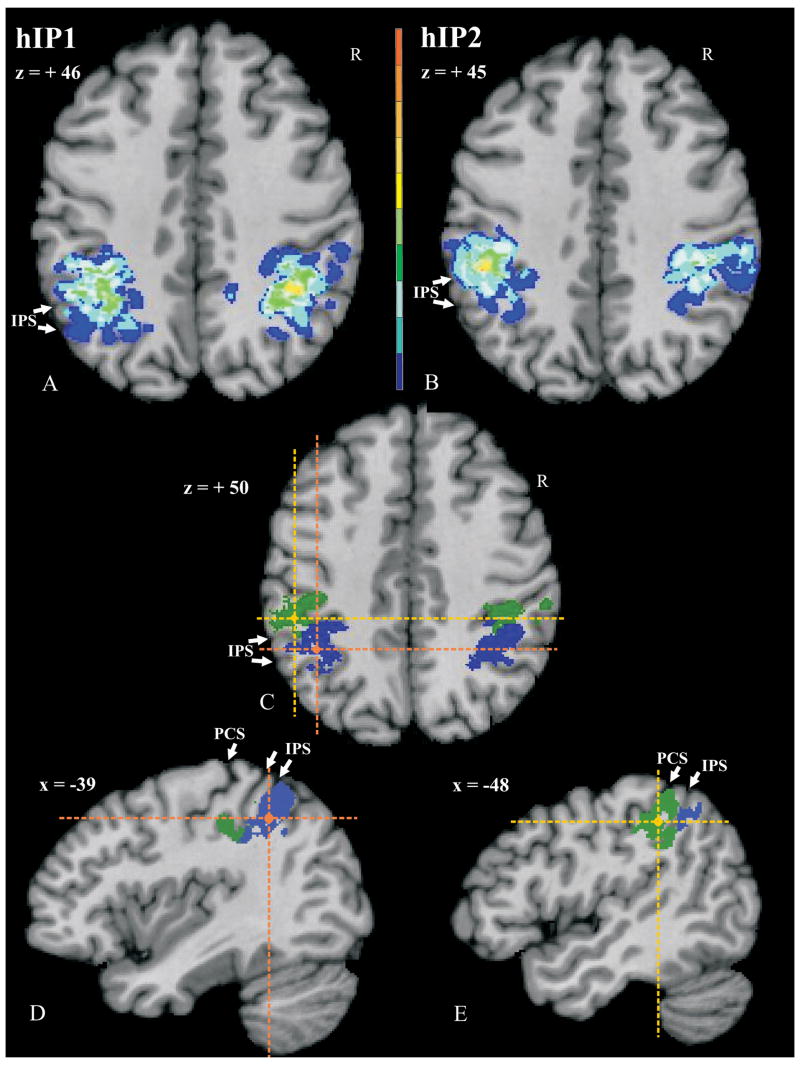
Anatomical studies in the macaque cortex and functional imaging studies in humans have demonstrated the existence of different cortical areas within the intraparietal sulcus (IPS). Such functional segregation, however, does not correlate with presently available architectonic maps of the human brain. This is particularly true for the classical Brodmann map, which is still widely used as an anatomical reference in functional imaging studies. The aim of this cytoarchitectonic mapping study was to use previously defined algorithms to determine whether consistent regions and borders can be found within the cortex of the anterior IPS in a population of 10 post-mortem human brains. Two areas, the human intraparietal area 1 (hIP1) and the human intraparietal area 2 (hIP2), were delineated in serial histological sections of the anterior, lateral bank of the human IPS. The region hIP1 is located posterior and medial to hIP2, and the former is always within the depths of the IPS. The latter, on the other hand, sometimes reaches the free surface of the superior parietal lobule. The delineations were registered to standard reference space, and probabilistic maps were calculated, thereby quantifying the intersubject variability in location and extent of both areas. In the future, they can be a tool for analyzing structure-function relationships and a basis for determining degrees of homology in the IPS among anthropoid primates. We conclude that the human IPS has a more finely grained parcellation than shown in Brodmann's map.


Figures

Figure 1
Figure 1
Classical cytoarchitectonic brain maps of the human brain adapted from (A) Brodmann (1909), (B) von Economo and Koskinas (1925) and (C) Gerhardt (1940). The areas of the anterior intraparietal sulcus are shaded grey. IPS – intraparietal sulcus, CS - central sulcus, SF- Sylvian fissure.
Figure 2
Figure 2
Flat-map of a macaque brain adapted from Lewis and Van Essen (2000a). (A) The map demonstrates anatomic relations of areas in the parietal lobe of an individual macaque brain. (B) shows the anterior IPS at a higher magnification. Note the location of areas AIP and VIP in the ventral anterior IPS. VIP has been subdivided into a medial (VIPm) and a lateral part (VIPl). AIP lies posteriorly from area 7t and laterally from 5V(ventral). Area VIP is located posteriorly from AIP. Its medial neighbor is 5V followed by area MIP (Medial IntraParietal area) more caudally. CeS – central sulcus, CgS – cingulate sulcus, POS – parieto-occipital sulcus, LuS – lunate sulcus, MIP – medial intraparietal area, LIPv/d – ventral/dorsal part of the lateral intraparietal area, PIP – posterior intraparietal area.
Figure 3
Figure 3
Observer-independent definition of cytoarchitectonic borders (Schleicher et al., 1999) has been performed in GLI images in cortical regions of interest (A). Dark pixels correspond to high GLI values (high volume fraction of cell bodies), whereas bright pixels correspond to low GLI values (low fraction). GLI profiles were extracted along vertical traverses, and numbered (1 to 129 in this example). Ten features or shape descriptors, based on central moments, were extracted from each profile. Using the multivariate Mahalanobis distance function, borders were defined at the positions where profiles changed significantly in shape. (B) shows a Mahalanobis distance function for neighboring blocks of profiles, each of which contained 14 profiles. Significant distance values were found at positions 16, 45 and 80, marked by arrows in (A) and (B). These positions mark the borders of areas hIP2 and hIP1.
Figure 4
Figure 4
Cytoarchitecture of areas hIP2 and hIP1 and intersubject differences in two individual brains No.2 (A–C) and No.9 (D–F). The rectangular frames in the corresponding overview-images (B, E) indicate the regions from which the micrographs were taken from. Note the differences in cell density and cell size in layers III to V between both areas. hIP2 (G) shows a higher volume fraction of cell bodies (GLI) in the deeper part of layer III and upper layer V as compared to hIP1 (H). hIP1 was also found to have a ‘buffering zone’ between layers III and IV which is indicated by stars (C, F, H). Roman numerals indicate cortical layers.
Figure 5
Figure 5
The mean GLI profile of areas hIP2 and hIP1 as measures of inter-areal differences of one left hemisphere (brain-No.6) and corresponding cytoarchitecture (hIP2: B; hIP1: C). Profiles were sampled in ROIs as indicated in (A). Areal borders are marked by arrows. (B, C) The GLI profiles express laminar changes in volume fraction of cell bodies from a cortical depth of 0 % (border between layers I and II) to a cortical depth of 100 % (white matter border). Note the differences in width of layers III and VI: hIP2 has a narrower layer III and a broader layer VI as compared to hIP1. Roman numerals refer to the cortical layers.
Figure 6
Figure 6
Volumes (mm3; ordinate) occupied by hIP1 (A) and hIP2 (B) of each brain (abscissa). Light gray - L: left hemisphere, dark gray - R: right hemisphere. Note the high inter-individual variability of volumes for areas hIP1 and hIP2. The volumes of hIP1 differed by a factor of 4 on the left hemisphere and by a factor of 3 on the right hemisphere. The volumes of hIP2 varied by a factor of 3 on the left hemisphere and by a factor of 5 on the right hemisphere. Inter-hemispheric differences were not significant.
Figure 7
Figure 7
Delineated areas hIP1 (blue) and hIP2 (green) are projected onto photographs of the dorsal surface of the 10 delineated postmortem brains. Note the considerable intersubject variability in the pattern of the IPS (orange) and PCS (yellow), as well as the variability in location and extent of both areas. Orange dotted line: IMPS, the side branch of the IPS, which divides the supramarginal gyrus from the angular gyrus. Note that in the caudal direction hIP1 does not extend beyond this side branch.
Figure 7
Figure 7
Delineated areas hIP1 (blue) and hIP2 (green) are projected onto photographs of the dorsal surface of the 10 delineated postmortem brains. Note the considerable intersubject variability in the pattern of the IPS (orange) and PCS (yellow), as well as the variability in location and extent of both areas. Orange dotted line: IMPS, the side branch of the IPS, which divides the supramarginal gyrus from the angular gyrus. Note that in the caudal direction hIP1 does not extend beyond this side branch.
Figure 8
Figure 8
The location of areas hIP1 and hIP2 in an individual brain (No.9, Table 1). (A) Surface rendering of the 3D-reconstructed postmortem brain; view from left, posterior, lateral. Note that in this case the PostCentral Sulcus (PCS, yellow) and the IntraParietal Sulcus (IPS, orange) are connected. Solid black lines on the surface of the brain mark the approximate location of 4 histological sections (n1-n4) also indicated in B – D. (B) Drawings of 15 serial histological sections (left hemisphere). Areas hIP1 (blue) and hIP2 (green) are marked. (C) 3D-reconstruction enabling an insight into the depth of the sulcal pattern of the IPS and PCS. Note the numerous dimples and foldings within the IPS. Both sulci show a complex pattern, which cannot be obtained from the inspection of the free surface of the brain alone. The IPS originates in a side branch of the PCS, which is located much more anteriorly than its appearance on the surface of the brain. (D) The topography of areas hIP2 and hIP1 in a “flat map”. Both areas are located in the lateral bank of the IPS. hIP2 lies more rostrally and laterally from hIP1. The assumed topographic relationship of areas hIP2 and hIP1 to surrounding Brodmann’s areas is shown. His area 2 (BA2; Grefkes et al. 2001), 5 (BA 5) and 7 (BA 7) are most likely to be found at this location independent from hIP2 and hIP1 in accordance with cytoarchitectonic studies of the human parietal cortex. Solid lines mark the fundus of a sulcus, dotted lines indicate the free surface of a gyrus.
Figure 8
Figure 8
The location of areas hIP1 and hIP2 in an individual brain (No.9, Table 1). (A) Surface rendering of the 3D-reconstructed postmortem brain; view from left, posterior, lateral. Note that in this case the PostCentral Sulcus (PCS, yellow) and the IntraParietal Sulcus (IPS, orange) are connected. Solid black lines on the surface of the brain mark the approximate location of 4 histological sections (n1-n4) also indicated in B – D. (B) Drawings of 15 serial histological sections (left hemisphere). Areas hIP1 (blue) and hIP2 (green) are marked. (C) 3D-reconstruction enabling an insight into the depth of the sulcal pattern of the IPS and PCS. Note the numerous dimples and foldings within the IPS. Both sulci show a complex pattern, which cannot be obtained from the inspection of the free surface of the brain alone. The IPS originates in a side branch of the PCS, which is located much more anteriorly than its appearance on the surface of the brain. (D) The topography of areas hIP2 and hIP1 in a “flat map”. Both areas are located in the lateral bank of the IPS. hIP2 lies more rostrally and laterally from hIP1. The assumed topographic relationship of areas hIP2 and hIP1 to surrounding Brodmann’s areas is shown. His area 2 (BA2; Grefkes et al. 2001), 5 (BA 5) and 7 (BA 7) are most likely to be found at this location independent from hIP2 and hIP1 in accordance with cytoarchitectonic studies of the human parietal cortex. Solid lines mark the fundus of a sulcus, dotted lines indicate the free surface of a gyrus.
Figure 9
Figure 9
Probability maps of the left hemisphere of areas hIP1 (A) at z = +46 and hIP2 (B) at z = +45. Maps are shown in the anatomical MNI-space with the AC as the origin (0/0/0) of the coordinate system according to the system of Talairach and Tournoux (1988). The number of overlapping brains is color-coded for each voxel. It ranges from dark blue (hIP1/hIP2 represented in 1 of 10 brains) to dark red (hIP1/hIP2 represented in all 10 brains). Note the high variability in location of both areas. (C) shows a horizontal section of the 40% maps of hIP1 (blue) and hIP2 (green) within one brain at z = +50. Crosses mark the level of corresponding sagittal sections of hIP1 (orange; D) at x = −39 and hIP2 (yellow; E) at x = −48. Note the topographical relationship between hIP2 and hIP1 in the rostro-caudal plane: hIP2 is located rostrally from hIP1. PCS, IPS – white arrowheads.

References

    1. Amunts K, Schleicher A, Bürgel U, Mohlberg H, Uylings HB, Zilles K. Broca's region revisited: cytoarchitecture and intersubject variability. J Comp Neurol. 1999;412:319–341. - PubMed
    1. Amunts K, Schleicher A, Ditterich A, Zilles K. Broca's region: cytoarchitectonic asymmetry and developmental changes. J Comp Neurol. 2003;465:72–89. Erratum in: J Comp Neurol. 467:270. - PubMed
    1. Amunts K, Weiss PH, Mohlberg H, Pieperhoff P, Eickhoff S, Gurd JM, Marshall JC, Shah NJ, Fink G, Zilles K. Analysis of neural mechanisms underlying verbal fluency in cytoarchitectonically defined stereotaxic space-The roles of Brodmann areas 44 and 45. NeuroImage. 2004;22:42–56. - PubMed
    1. Andersen RA, Brotchie PR, Mazzoni P. Evidence for the lateral intraparietal area as the parietal eye field. Curr Opin Neurobiol. 1992;2:840–846. - PubMed
    1. Armstrong E, Zilles K, Schlaug G, Schleicher A. Comparative aspects of the primate posterior cingulate cortex. JCompNeurol. 1986;253:539–548. - PubMed

Publication types

MeSH terms