Review
. 2005 Nov 29;360(1463):2021-35.
doi: 10.1098/rstb.2005.1752.

Crop responses to climatic variation

Affiliations
Review

Crop responses to climatic variation

John R Porter et al. Philos Trans R Soc Lond B Biol Sci. .

Abstract

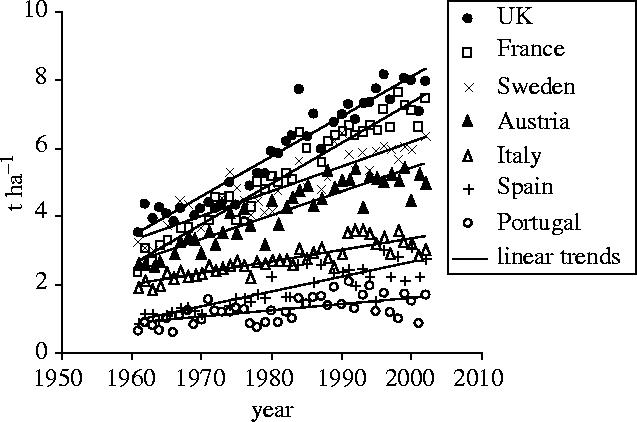
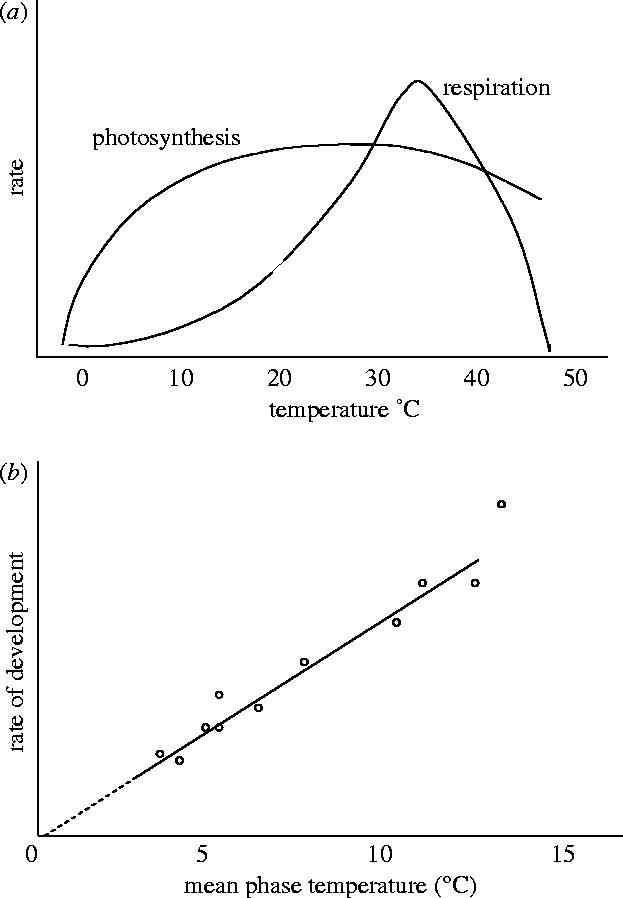
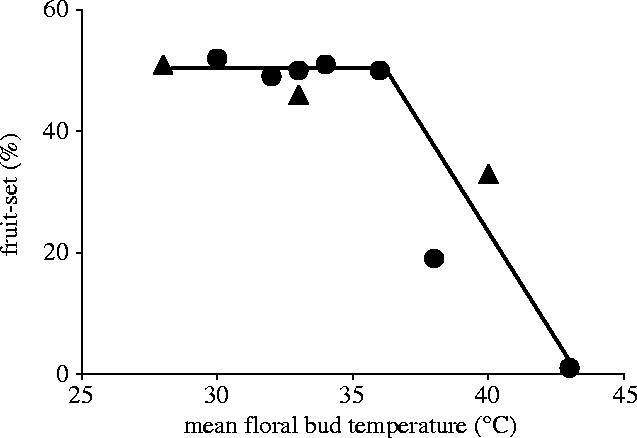
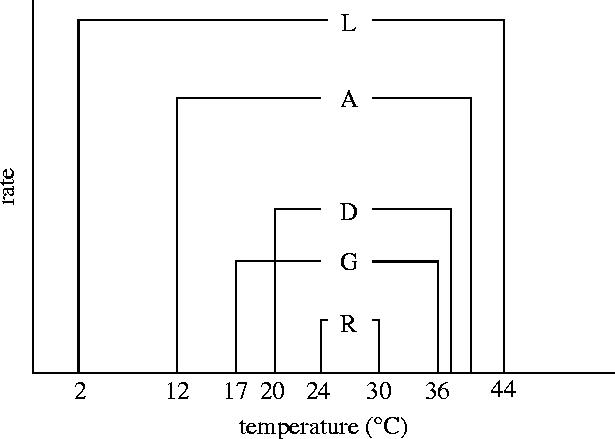
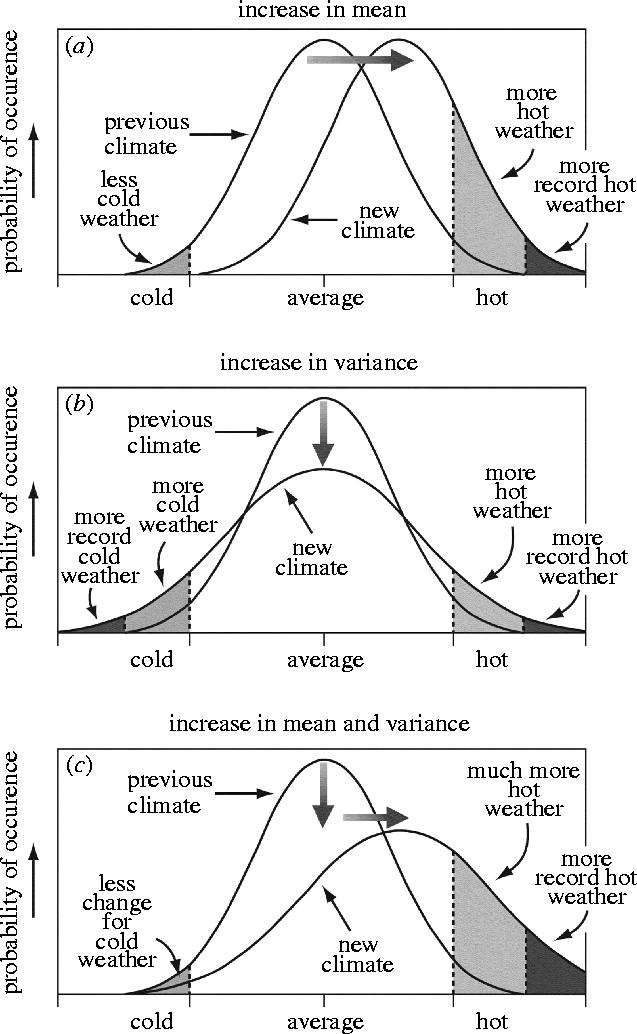
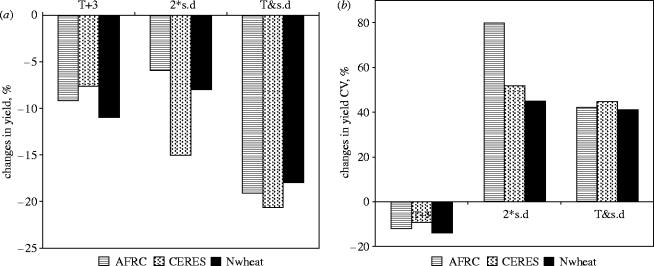
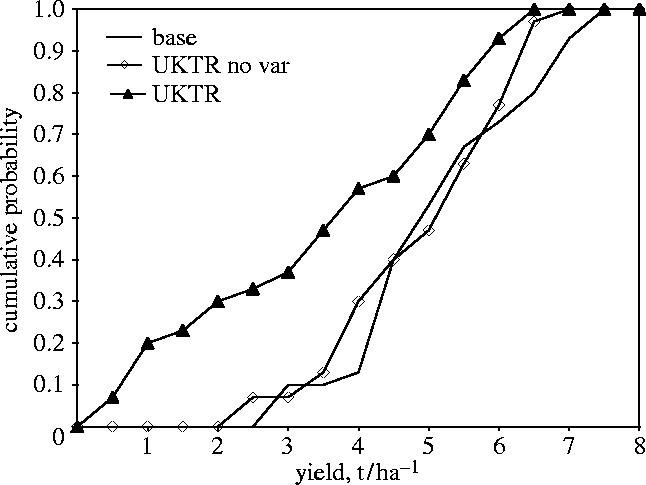
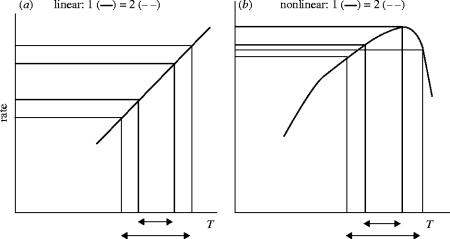
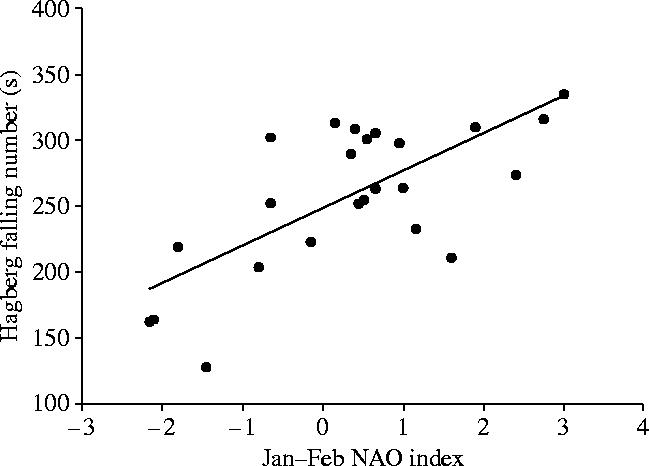
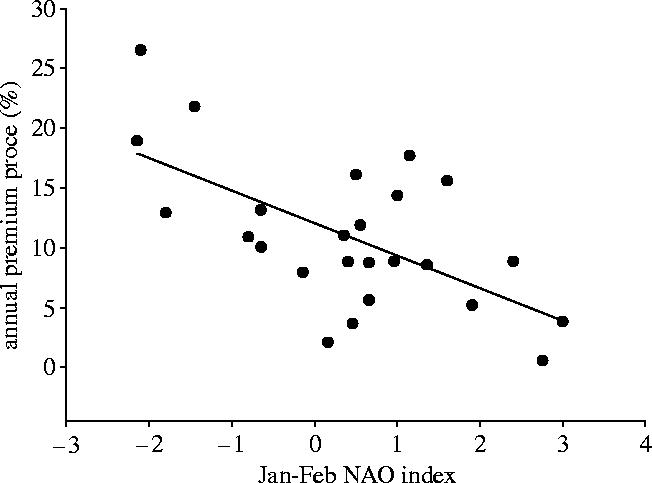
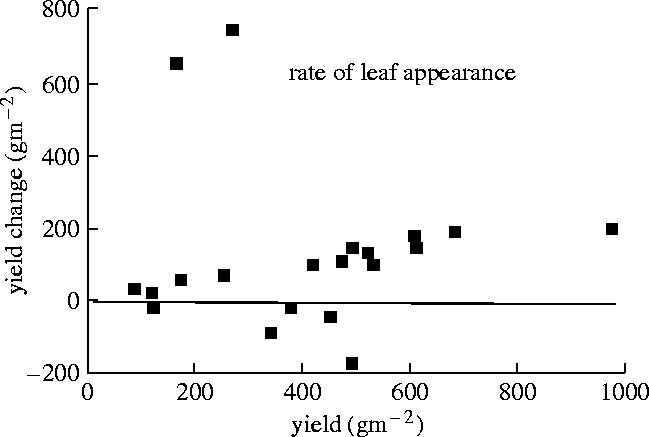
The yield and quality of food crops is central to the well being of humans and is directly affected by climate and weather. Initial studies of climate change on crops focussed on effects of increased carbon dioxide (CO2) level and/or global mean temperature and/or rainfall and nutrition on crop production. However, crops can respond nonlinearly to changes in their growing conditions, exhibit threshold responses and are subject to combinations of stress factors that affect their growth, development and yield. Thus, climate variability and changes in the frequency of extreme events are important for yield, its stability and quality. In this context, threshold temperatures for crop processes are found not to differ greatly for different crops and are important to define for the major food crops, to assist climate modellers predict the occurrence of crop critical temperatures and their temporal resolution. This paper demonstrates the impacts of climate variability for crop production in a number of crops. Increasing temperature and precipitation variability increases the risks to yield, as shown via computer simulation and experimental studies. The issue of food quality has not been given sufficient importance when assessing the impact of climate change for food and this is addressed. Using simulation models of wheat, the concentration of grain protein is shown to respond to changes in the mean and variability of temperature and precipitation events. The paper concludes with discussion of adaptation possibilities for crops in response to drought and argues that characters that enable better exploration of the soil and slower leaf canopy expansion could lead to crop higher transpiration efficiency.


Figures

Figure 1
Figure 1
Observed (FAO 2003) grain yields of wheat for selected countries in Europe.
Figure 2
Figure 2
Changes in the rate of (a) C3 photosynthesis and respiration and (b) rate of crop development as a function of temperature.
Figure 3
Figure 3
Mean, minimum and maximum temperatures at the experimental site at for the heat episode experiment from March until September 1997. During heat events (HT), the plants were transferred to growth chambers and higher temperatures applied as indicated (Wollenweber et al. 2003).
Figure 4
Figure 4
Rate of light-saturated photosynthetic CO2 assimilation (Asat) as a function of CO2 concentration inside the leaf mesophyll (Ci). Each symbol represents means of two independent measurements. DR, double-ridge stage; AN, anthesis; HT, heat event (25 °C at DR, 35 °C at AN) (Wollenweber et al. 2003).
Figure 5
Figure 5
Relationship between percentage fruit set (angular transformed data) and mean floral temperature, from 08:00 to 14:00 h, 9 days after flowering in groundnut (Vara Prasad et al. 2000).
Figure 6
Figure 6
Thermal limits for reproductive (R), growth (G), development (D), activity (A) and lethal (L) thermal limits in Cyprinodon n. nevadensis (Shrode & Gerking 1977; Gerking & Lee 1983 and quoted in Cossins & Bowler, 1987).
Figure 7
Figure 7
The anomaly range in northern hemisphere surface temperature from 1400 AD to the present and associated change in ambient CO2 concentration (Mann et al. 1998).
Figure 8
Figure 8
Time-series of maize yields in Zimbabwe and sea-surface temperatures in the Nino3 region. The correlation between the time-series is 0.78 (Cane et al. 1994).
Figure 9
Figure 9
Postulated changes in the distribution of temperatures involving changes in their (a) mean, (b) variance and (c) both on the frequency of occurrence of extreme conditions (IPCC 2001).
Figure 10
Figure 10
Modelling of the effect of variation in temperature on (a) crop yields and (b) its variation (as CV) for wheat. T+3, mean temperature increased by 3 °C (cf. figure 9a); 2×s.d., standard deviation of temperature doubled without change in its mean value (cf. figure 9b); T & s.d., combination of raised mean and standard deviation of temperature (cf. figure 9c).
Figure 11
Figure 11
Cumulative probability functions of grain yield as simulated by SIRIUS Wheat (Jamieson et al. 1998) for the base climate and for the UKTR scenarios with and without changes in climatic variability.
Figure 12
Figure 12
Diagrams showing how the rates of a linear and nonlinear crop process may respond to differences in the amplitude (maximum minus minimum value) of temperature (T). Part (a) shows a linear process, where two amplitudes of temperature (defined by the arrows) lead to the same average rate of a process, i.e. the rate is independent of amplitude. Part (b) shows that the same amplitude as in (a) leads to two different rates for the process for a nonlinear process, making the rate dependent on amplitude.
Figure 13
Figure 13
Relationship between the NAO index from 1972 to 1996 and the HFN of UK wheat (Kettlewell et al. 1999).
Figure 14
Figure 14
Relationship between the NAO index from 1972 to 1996 and the premium price of UK wheat (Kettlewell et al. 1999).
Figure 15
Figure 15
Yield change for each of 20 years from a maize crop with a relatively rapid leaf appearance rate (baseline) to one with a slower rate, plotted against yield simulated for the baseline (Sinclair & Muchow 2001).

References

    1. Adams R.M, Rosenzweig C, Pearl R.M, Ritchie J.T, McCarl B.A, Glyer J.D, Curry R.B, Jones J.W, Boote K.J, Allen L.H., Jr Global climate change and US agriculture. Nature. 1990;345:219–224. doi:10.1038/345219a0 - DOI
    1. Al Khatib K, Paulsen G.M. High temperature effects on photosynthetic processes in temperate and tropical cereals. Crop Sci. 1999;39:119–125.
    1. Amthor J.S. Respiration in a future, higher-CO2 world. Plant Cell Environ. 1991;14:13–20.
    1. Bolanos J, Edmeades G.O, Martinez L. Eight cycles of selection for drought tolerance in lowland tropical maize: III. Responses to drought-adaptive physiological and morphological traits. Field Crop Res. 1993;31:269–286.
    1. Bowes G. Growth at elevated CO2: photosynthetic responses mediated through Rubisco. Plant Cell Environ. 1991;14:795–806.

LinkOut - more resources