. 2006 Jan 24:7:8.
doi: 10.1186/1471-2202-7-8.

Effects of lipopolysaccharide-induced inflammation on expression of growth-associated genes by corticospinal neurons

Affiliations

Effects of lipopolysaccharide-induced inflammation on expression of growth-associated genes by corticospinal neurons

M K Hossain-Ibrahim et al. BMC Neurosci. .

Abstract

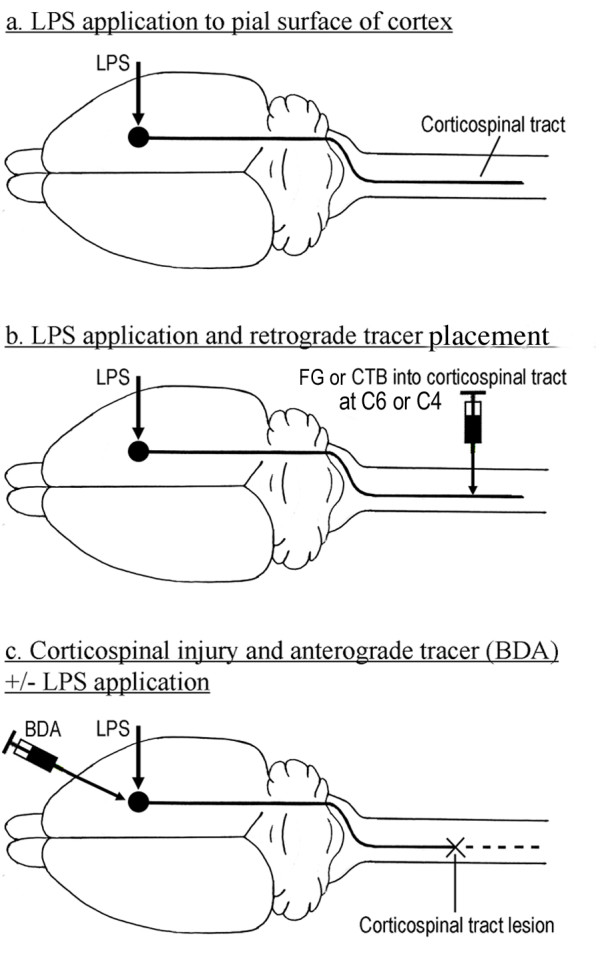
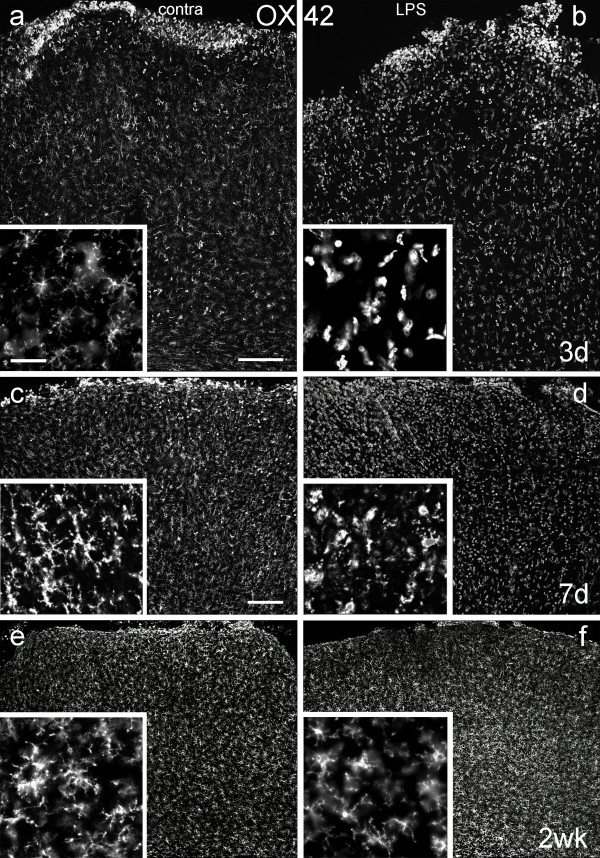
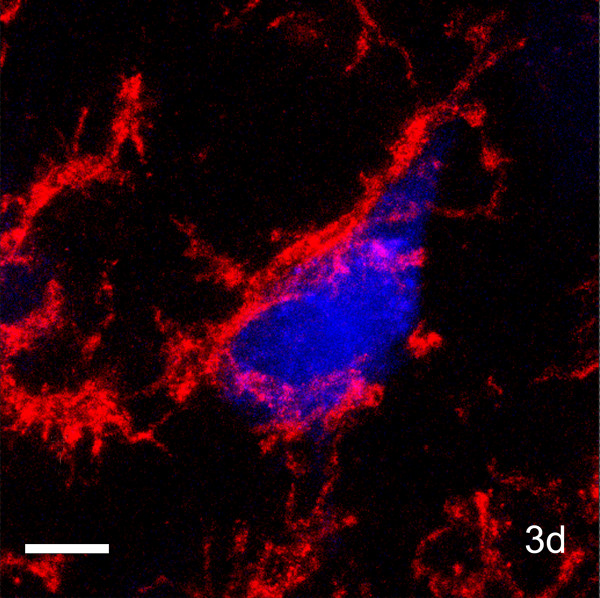
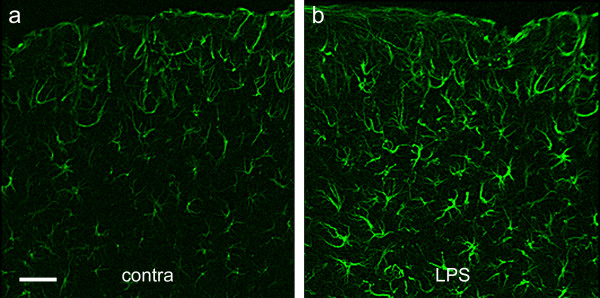
Background: Inflammation around cell bodies of primary sensory neurons and retinal ganglion cells enhances expression of neuronal growth-associated genes and stimulates axonal regeneration. We have asked if inflammation would have similar effects on corticospinal neurons, which normally show little response to spinal cord injury. Lipopolysaccharide (LPS) was applied onto the pial surface of the motor cortex of adult rats with or without concomitant injury of the corticospinal tract at C4. Inflammation around corticospinal tract cell bodies in the motor cortex was assessed by immunohistochemistry for OX42 (a microglia and macrophage marker). Expression of growth-associated genes c-jun, ATF3, SCG10 and GAP-43 was investigated by immunohistochemistry or in situ hybridisation.

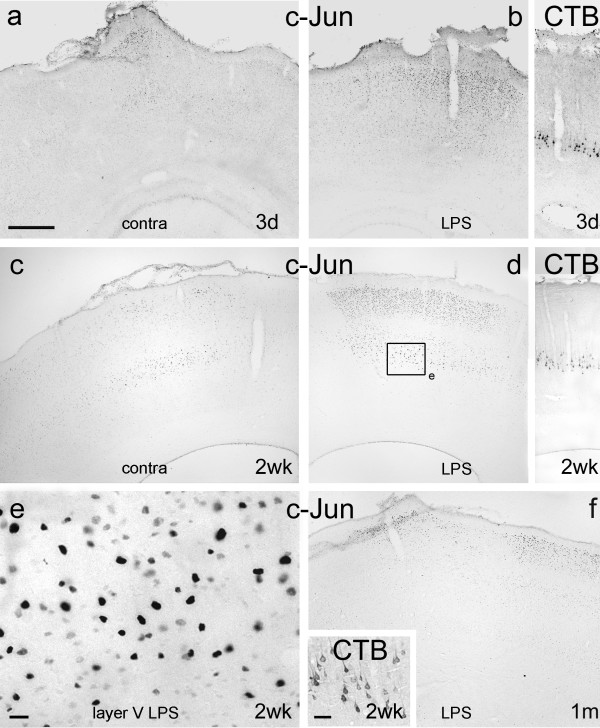
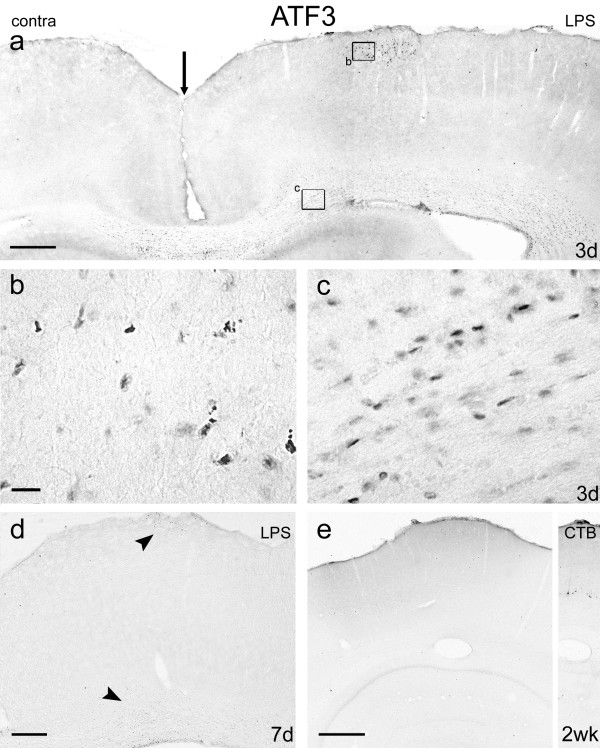
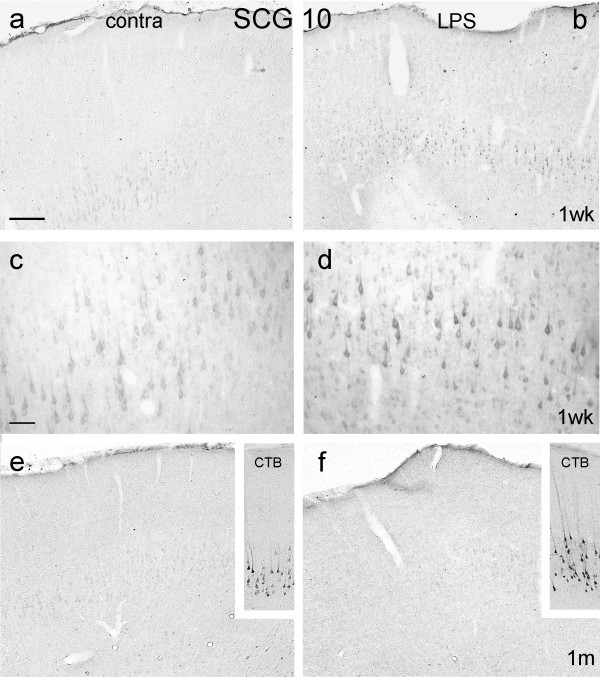
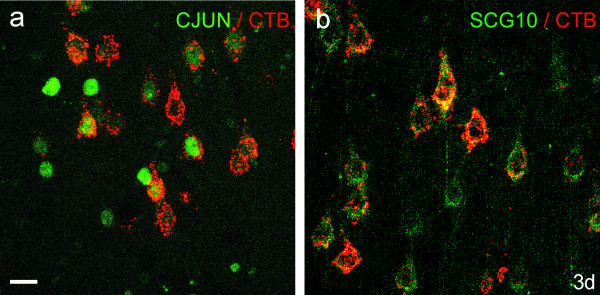
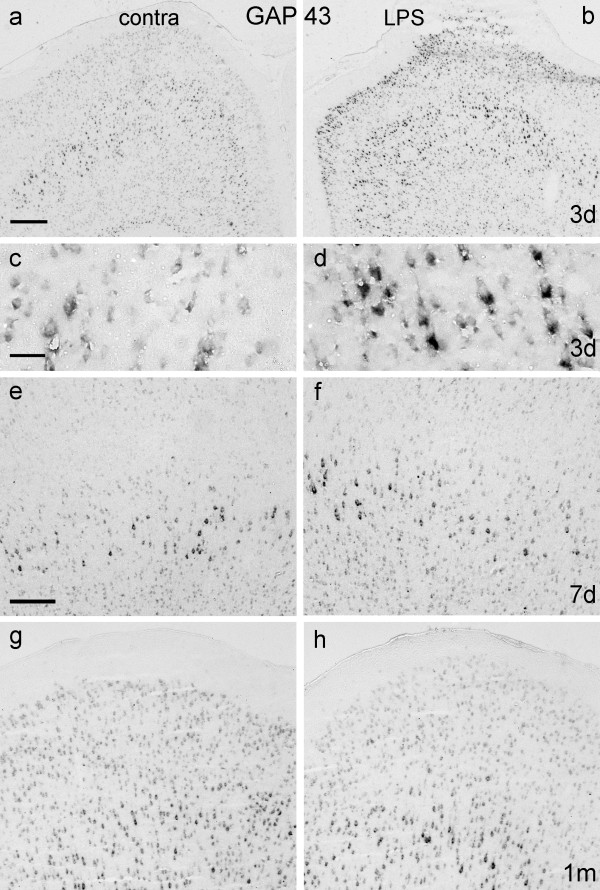
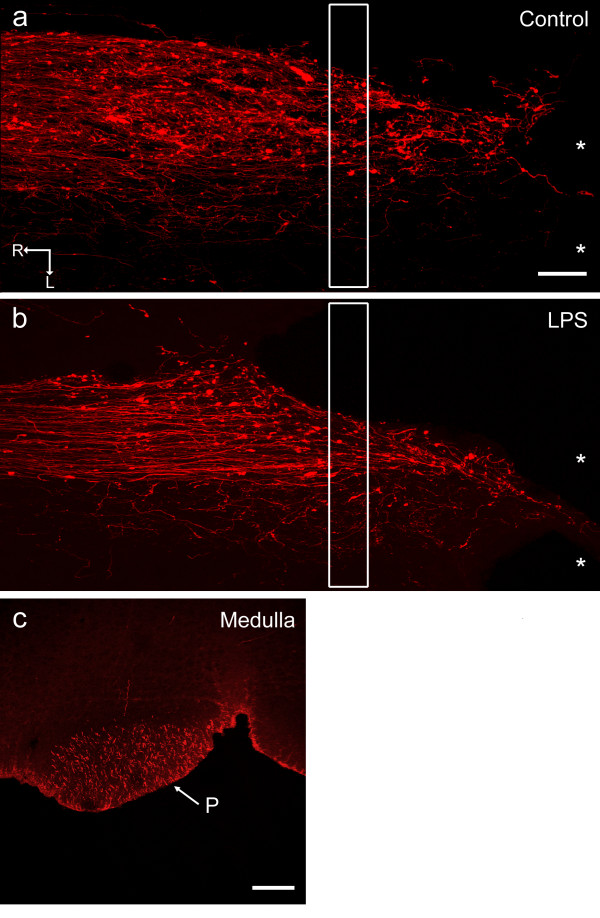
Results: Application of LPS induced a gradient of inflammation through the full depth of the motor cortex and promoted c-Jun and SCG10 expression for up to 2 weeks, and GAP-43 upregulation for 3 days by many corticospinal neurons, but had very limited effects on neuronal ATF3 expression. However, many glial cells in the subcortical white matter upregulated ATF3. LPS did not promote sprouting of anterogradely labelled corticospinal axons, which did not grow into or beyond a cervical lesion site.

Conclusion: Inflammation produced by topical application of LPS promoted increased expression of some growth-associated genes in the cell bodies of corticospinal neurons, but was insufficient to promote regeneration of the corticospinal tract.


Figures

Figure 1
Figure 1
Schematic diagrams showing experimental design and procedures. a. Unilateral application of lipopolysaccharide (LPS) to the pial surface of motor cortex through a cranial burrhole with sham operation on the contralateral side, to investigate the inflammatory response and expression of growth-associated proteins. b. Unilateral LPS application to the pial surface and injection of Cholera toxin B or placement of Fluorogold (FG) (retrograde tracers) into the contralateral corticospinal tract (CST) at C4 or C6 respectively, to identify CST neurons displaying changes in growth-associated protein expression. c. Application to the pial surface of LPS with injection of biotinylated dextran amine (BDA; anterograde tracer) into motor cortex and transection of contralateral CST. LPS application omitted in control animals.
Figure 2
Figure 2
Microglial responses to LPS application. Coronal sections of motor cortex, immunoreacted with OX42 antibody to visualise microglia/macrophages 3 days (Figs 2a, b), 7 days (Figs 2c, d) and 2 weeks (Figs 2e, f) after unilateral application of LPS to the pial surface (Figs 2b, d, f) or sham operations on the contralateral (contra), control side (Figs 2a, c, e). Here and in all other figures, the pial surface is at the top and all sections are photographed immediately below the craniotomy, with the same exposure for all pairs of images taken at each survival time. Microglia from layer V are illustrated at higher magnification in the insets. Note that microglia are present throughout the full depth of cortex at all time points and are ramified in the control but are rounded and amoeboid and more numerous in the LPS-treated cortical tissue 3 days and 7 days after LPS application. The numerous immunoreactive cells at the pial surface on both sides of the brain (Figs 2a, b) are likely to be macrophages of haematogenous origin induced by local damage due to craniotomy. Note the reduction in number of such cells at 7 days and that very few remain at two weeks. Scale bar in Fig. 2a = 200 μm and also applies to Fig. 2b; scale bar in Fig. 2c = 200 μm and also applies to Figs 2d – f (Figs 2a and b are of greater magnification than Figs. 2c – f); scale bar in the inset to Fig. 2a = 50 μm and applies to all insets.
Figure 3
Figure 3
Microglial response around identified CST neuron after LPS application. Coronal section of OX42-immunoreacted motor cortex (layer V) 3 days after LPS administration and simultaneous application of Fluorogold to a lesion of contralateral cord at C6. Note the very close association between the microglial cell (red) and the retrogradely-labelled (blue) CST neuronal cell body. Scale bar = 10 μm.
Figure 4
Figure 4
Astrocytic response to LPS application. Coronal sections of GFAP-immunostained motor cortex below the area of LPS application (Fig. 4b) or sham operation (Fig. 4a) on the contralateral (contra), control side, 3 days after application of LPS. Note that astrocytes are present throughout the full depth of cortex and are more brightly fluorescent in the LPS-treated cortex, with thicker processes than in the control cortex. Scale bar in Fig. 4a = 200 μm and also applies to Fig. 4b.
Figure 5
Figure 5
Expression of c-Jun after LPS application. Coronal sections of motor cortex 3 days (Figs 5a, b), 2 weeks (Figs 5c – e) and 1 month (Fig. 5f) after unilateral application of LPS, or sham operation (Figs 5a, c), immunoreacted for c-Jun or CTB (insets to Figs 5b, d and f). Note that, at 3 days c-Jun is detectable in layers II, III and V at low levels immediately below the craniotomy on the control side, but is almost undetectable more medially and laterally, and that c-Jun immunoreactivity is much stronger on the treated side, predominantly in layers II, III and V, immediately below the site of LPS application. Note also the marked increase in c-Jun immunoreactivity in layers II, III and V immediately below the burr hole and site of LPS application in Fig. 5d compared to the corresponding contralateral cortex in Fig. 5c. The framed area of layer V in Fig. 5d is enlarged in Fig. 5e to show details of immunostained nuclei. The insets to Fig. 5b and d are taken from the section immediately serial to the ones shown in Figs 5b and d and demonstrates that retrogradely labelled CST neurons occupy the same area (in layer V) as neurons displaying upregulation of c-Jun expression. Some of the retrogradely labelled cells in Fig. 5d are shown at greater magnification in the inset to Fig. 5f. Note also that at one month, c-Jun immunoreactivity in layers II and III of the experimental side still involves areas medial and lateral to the site of LPS application with almost no c-Jun detectable in layer V (c-Jun immunoreactivity in the contralateral cortex is weak and largely confined to layers II and III: not shown). Scale bar = 500 μm and applies to Figs 5a – d and f); bar in Fig. 5e = 20 μm; bar in Fig. 5f inset = 50 μm.
Figure 6
Figure 6
Expression of ATF3 after LPS application. Coronal sections of motor cortex immunoreacted for ATF3, 3 days (Figs 6a, b, c), 7 days (Fig. 6d) and 2 weeks (Fig. 6e) after LPS application. Fig. 6a shows both the experimental and the medial part of the control cortex (midline at the vertical arrow) and demonstrates ATF3 immunoreactivity directly under the area of the burr hole and in the subcortical white matter on the experimental side. The superficial upregulation is localised, but immunoreactive cells in the white matter extend for 2 mm laterally and 400 μm across the midline. There is no ATF3 immunoreactivity in cortical neurons located in layers III to VI or in the contralateral (control) cortex. Fig. 6b is enlarged from the boxed area of cortex directly under the site of LPS application in Fig. 6a. Note the irregular shape of ATF3-positive nuclei, suggesting possible damage or apoptosis. Fig. 6c is enlarged from the boxed area of white matter in Fig. 6a. ATF3-positive nuclei are seen arranged in a linear fashion, suggesting that they are white matter glial cells. Fig. 6d, 7 days after LPS application shows reduced ATF3 immunoreactivity directly under the LPS application site (top arrow) and in the subcortical white matter (bottom arrow). Fig. 6e shows no ATF3 immunoreactivity 2 weeks after LPS application. The inset is from the immediately serial section, directly beneath the LPS application site and demonstrates CST neurons retrogradely labelled with CTB. No ATF3 immunoreactivity was seen in the area of cortex where the CTB-labelled CST neurons were located. Scale bar in Figs 6a and e = 500 μm; bar in Fig. 6b = 50 μm and also applies to Fig. 6c; bar in Fig. 6d = 200 μm.
Figure 7
Figure 7
Expresssion of SCG10 after LPS application. Coronal sections of motor cortex immunoreacted for SCG10 (except for insets), 1 week (Figs 7a – d) and 1 month (Figs 7e, f) after LPS application. Control, contralateral cortex is shown in Figs 7a, c and e, LPS-treated cortex in Figs 7b, d and f. Note increased SCG10 immunoreactivity in layer V cells at one week in Fig. 7b compared to contralateral cortex (Fig. 7a), and absence of immunoreactivity in more superficial cortex. Fig. 7c is enlarged from layer V in Fig. 7a and Fig. 7d is enlarged from layer V in Fig. 7b. One month after LPS application there is only a background level of SCG10 immunoreactivity in layer V cells of both contralateral (Fig. 7e) and ipsilateral (Fig. 7f) cortex. The insets are from immediately serial sections to Figs 7e and 7f and show retrogradely CTB-labelled CST neurons in layer V. Bar in Fig. 7a = 200 μm and also applies to Figs 7b, e, f and insets; bar in Fig. 7c = 50 μm and also applies to Fig. 7d.
Figure 8
Figure 8
Co-localisation of retrograde label and c-Jun or SCG10. CTB (red) in the cell bodies of CST neurons co-localised with c-Jun (Fig. 8a) or SCG10 (Fig. 8b) (green) in coronal sections of the motor cortex (layer V), 3 days after application of LPS and simultaneous injection of CTB into the CST at C4. Note that not all layer V neurons expressing c-Jun in their nuclei also show co-localisation with CTB (Fig. 8a). There is a higher degree of co-localisation between SCG10 and CTB (Fig. 8b). Confocal microscopy; scale bar = 20 μm and applies to both images.
Figure 9
Figure 9
GAP-43 mRNA expression after LPS application. Coronal sections of motor cortex hybridised with GAP-43 mRNA probe 3 days (Figs 9a – d), 7 days (Figs 9e, f) and 1 month (Figs 9g, h) after unilateral application of LPS (Figs 9b, d, f, h) or sham operations to the contralateral (control) side (Figs 9a, c, e, g). Background levels of GAP-43 mRNA are seen in contralateral (control) cortex at 3 days but stronger expression is apparent in layers II–V of LPS-treated cortex. Areas of layer V in Fig. 9a and b are enlarged in Fig. 9c and d to better show differences in hybridisation signals. By 7 days (Figs 9e and 9f), GAP-43 mRNA expression appears to be identical on both sides, and remains so one month after LPS application (Figs 9g and h). Scale bar in Fig. 9a = 500 μm and also applies to Fig. 9b; scale bar in Fig. 9c = 50 μm and also applies to Fig. 9d; scale bar in Fig. 9e = 200 μm and also applies to Figs 9f – h.
Figure 10
Figure 10
Anterograde labelling of CST axons after spinal cord injury and LPS application. Horizontal sections through spinal cord injury sites (Figs 10a, b), and a transverse section through the medulla (Fig. 10c) 21 days after lesion of the CST at C4 with either simultaneous injection of BDA into contralateral motor cortex (Control) or injection of BDA into and application of LPS onto motor cortex (LPS). In both the LPS-treated (Fig. 10b) and control tissue (Fig. 10a), end bulbs are seen at the tips of large numbers of axons. There is little sign of axon branching into the contralateral CST, and the labelled axons extending into the lesion site are located in a strand of spared tissue that extends no more than 50 μm. No axons appear to circumnavigate or regenerate beyond the lesion site. The white boxes correspond to the counting frame windows. Fig. 10c shows BDA-labelled CST axons in the pyramid of the medulla (midline at arrow). All images are confocal; * = lesion site; R = rostral; L = lateral; P = pyramid; scale bar in Fig. 10a = 100 μm and also applies to Fig. 10b; bar in Fig. 10c = 200 μm.

References

    1. Lu X, Richardson PM. Inflammation near the nerve cell body enhances axonal regeneration. J Neurosci. 1991;11:972–978. - PMC - PubMed
    1. Leon S, Yin Y, Nguyen J, Irwin N, Benowitz LI. Lens injury stimulates axon regeneration in the mature rat optic nerve. J Neurosci. 2000;20:4615–4626. - PMC - PubMed
    1. Yin Y, Cui Q, Li Y, Irwin N, Fischer D, Harvey AR, Benowitz LI. Macrophage-derived factors stimulate optic nerve regeneration. J Neurosci. 2003;23:2284–2293. - PMC - PubMed
    1. Richardson PM, McGuinness UM, Aguayo AJ. Peripheral nerve autografts to the rat spinal cord: studies with axonal tracing methods. Brain Res. 1982;237:147–162. doi: 10.1016/0006-8993(82)90563-7. - DOI - PubMed
    1. Ye JH, Houle JD. Treatment of the chronically injured spinal cord with neurotrophic factors can promote axonal regeneration from supraspinal neurons. Exp Neurol. 1997;143:70–81. doi: 10.1006/exnr.1996.6353. - DOI - PubMed

Publication types

MeSH terms

Substances