

Analysis of molecular diversity, population structure and linkage disequilibrium in a worldwide survey of cultivated barley germplasm (Hordeum vulgare L.)
- PMID: 16433922
- PMCID: PMC1408084
- DOI: 10.1186/1471-2156-7-6
Analysis of molecular diversity, population structure and linkage disequilibrium in a worldwide survey of cultivated barley germplasm (Hordeum vulgare L.)
Abstract
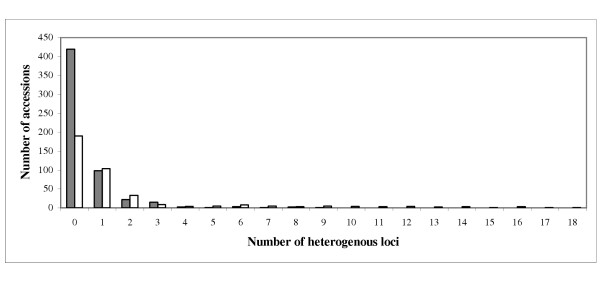
Background: The goal of our study was a systematic survey of the molecular diversity in barley genetic resources. To this end 953 cultivated barley accessions originating from all inhabited continents except Australia were genotyped with 48 SSR markers. Molecular diversity was evaluated with routine statistics (allelic richness, gene diversity, allele frequency, heterozygosity and unique alleles), Principal Coordinate Analysis (PCoA), and analysis of genome-wide linkage disequilibrium.
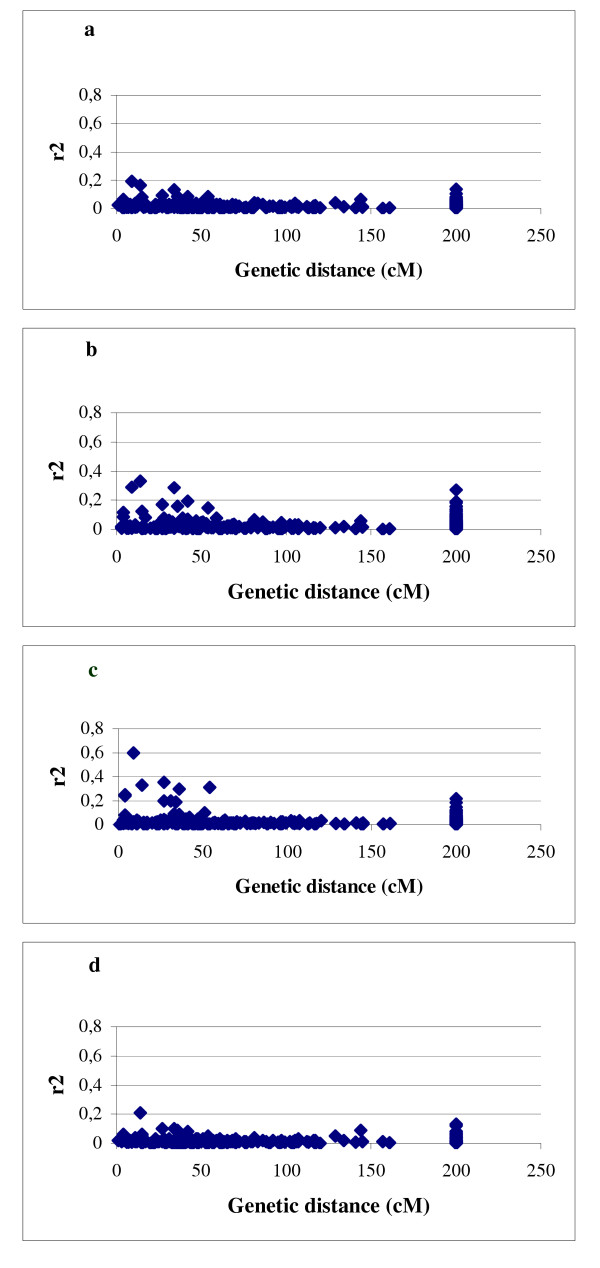
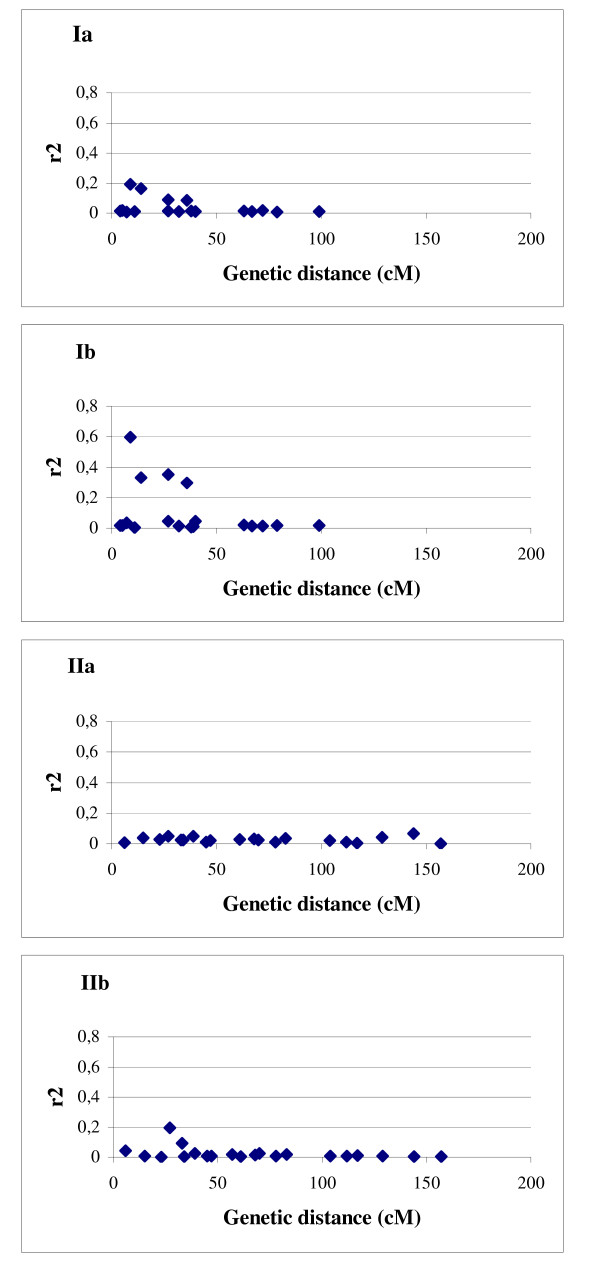
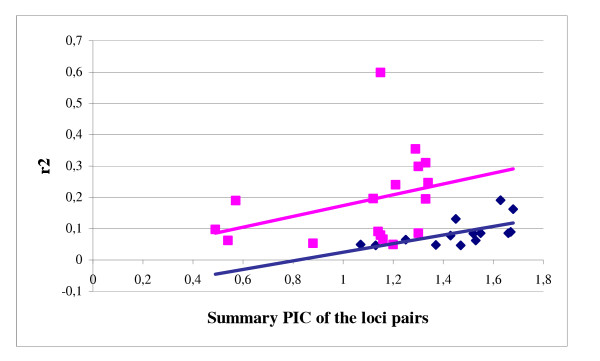
Results: A genotyping database for 953 cultivated barley accessions profiled with 48 SSR markers was established. The PCoA revealed structuring of the barley population with regard to (i) geographical regions and (ii) agronomic traits. Geographic origin contributed most to the observed molecular diversity. Genome-wide linkage disequilibrium (LD) was estimated as squared correlation of allele frequencies (r2). The values of LD for barley were comparable to other plant species (conifers, poplar, maize). The pattern of intrachromosomal LD with distances between the genomic loci ranging from 1 to 150 cM revealed that in barley LD extended up to distances as long as 50 cM with r2 > 0.05, or up to 10 cM with r2 > 0.2. Few loci mapping to different chromosomes showed significant LD with r2 > 0.05. The number of loci in significant LD as well as the pattern of LD were clearly dependent on the population structure. The LD in the homogenous group of 207 European 2-rowed spring barleys compared to the highly structured worldwide barley population was increased in the number of loci pairs with r2 > 0.05 and had higher values of r2, although the percentage of intrachromosomal loci pairs in significant LD based on P < 0.001 was 100% in the whole set of varieties, but only 45% in the subgroup of European 2-rowed spring barleys. The value of LD also varied depending on the polymorphism of the loci selected for genotyping. The 17 most polymorphic loci (PIC > 0.80) provided higher LD values as compared to 19 low polymorphic loci (PIC < 0.73) in both structured (all accessions) and non-structured (European 2-rowed spring varieties) barley populations.
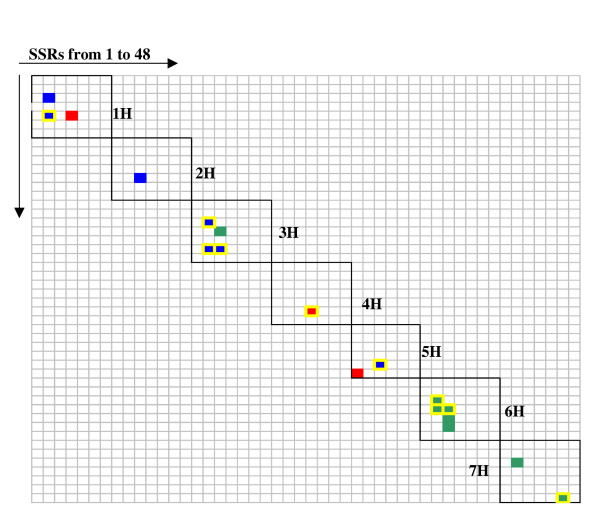
Conclusion: A global population of cultivated barley accessions was highly structured. Clustering highlighted the accessions with the same geographic origin, as well as accessions possessing similar agronomic characters. LD in barley extended up to 50 cM, and was strongly dependent on the population structure. The data on LD were summarized as a genome-wide LD map for barley.
Figures
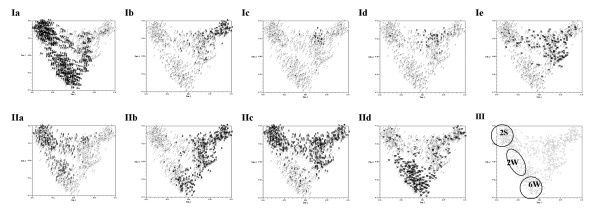
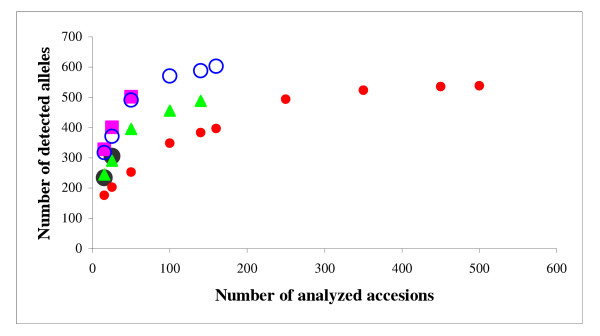
 – Near East,
  – Asia,
  – Africa,
  – America,
  – Europe.
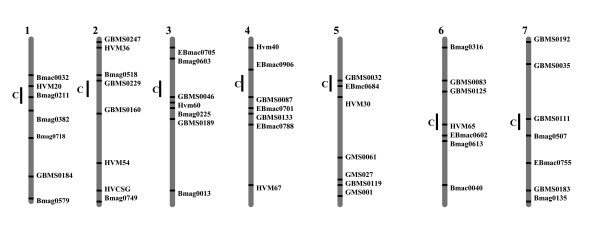
References
-
- Maestri E, Malcevschi A, Massari A, Marmiloni N. Genomic analysis of cultivated barley (Hordeum vulgare) using sequence-tagged molecular markers. Estimates of divergence based on RFLP and PCR markers derived from stress-responsive genes, and simple-sequence repeats (SSRs) Mol Genet Genomics. 2002;267:186–201. doi: 10.1007/s00438-002-0650-0. - DOI - PubMed
-
- Baek HJ, Beharav A, Nevo E. Ecological-genomic diversity of microsatellites in wild barley, Hordeum spontaneum, populations in Jordan. Theor Appl Genet. 2003;106:397–410. - PubMed
-
- Koebner RM, Donini P, Reeves JC, Cooke RJ, Law JR. Temporal flux in the morphological and molecular diversity of UK barley. Theor Appl Genet. 2003;106:550–8. - PubMed
Publication types
MeSH terms
LinkOut - more resources
Full Text Sources
Research Materials
