. 2006 Jan 24:7:12.
doi: 10.1186/1471-2164-7-12.

Colour variation in red grapevines (Vitis vinifera L.): genomic organisation, expression of flavonoid 3'-hydroxylase, flavonoid 3',5'-hydroxylase genes and related metabolite profiling of red cyanidin-/blue delphinidin-based anthocyanins in berry skin

Affiliations

Colour variation in red grapevines (Vitis vinifera L.): genomic organisation, expression of flavonoid 3'-hydroxylase, flavonoid 3',5'-hydroxylase genes and related metabolite profiling of red cyanidin-/blue delphinidin-based anthocyanins in berry skin

Simone D Castellarin et al. BMC Genomics. .

Abstract

Background: Structural genes of the phenyl-propanoid pathway which encode flavonoid 3'- and 3',5'-hydroxylases (F3'H and F3'5'H) have long been invoked to explain the biosynthesis of cyanidin- and delphinidin-based anthocyanin pigments in the so-called red cultivars of grapevine. The relative proportion of the two types of anthocyanins is largely under genetic control and determines the colour variation among red/purple/blue berry grape varieties and their corresponding wines.

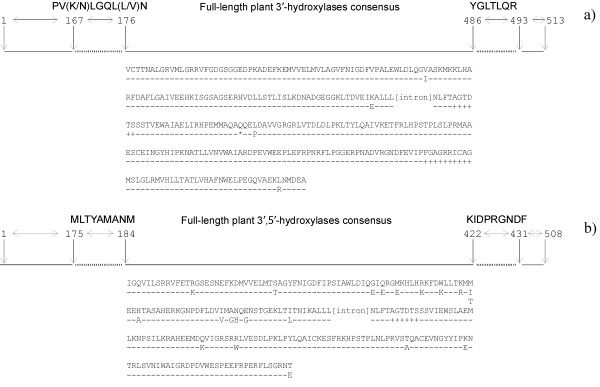
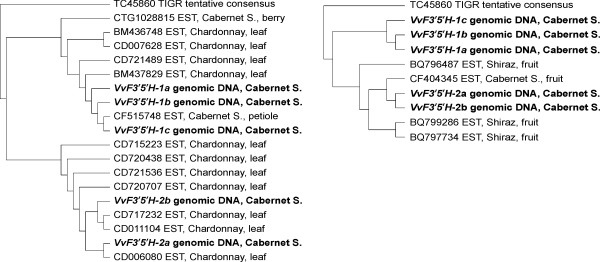
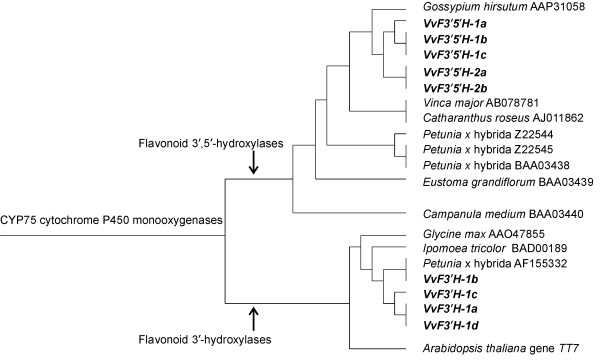
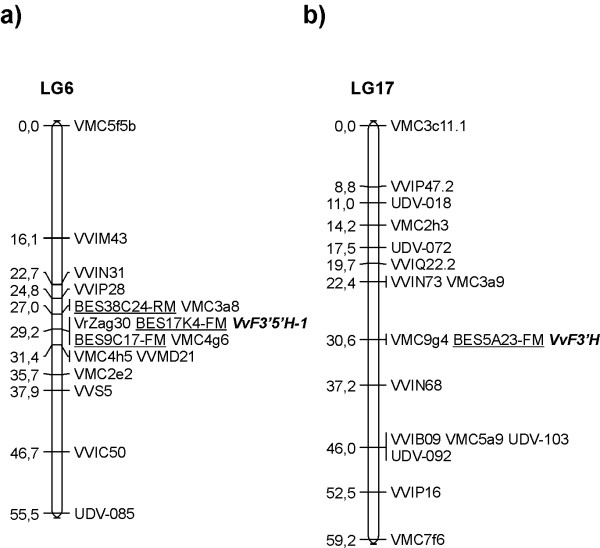
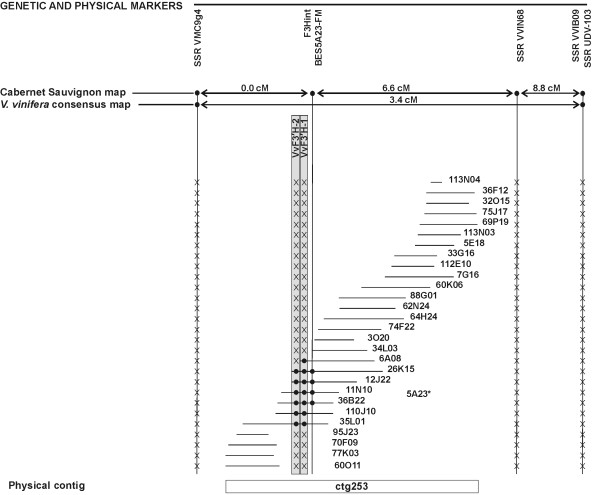
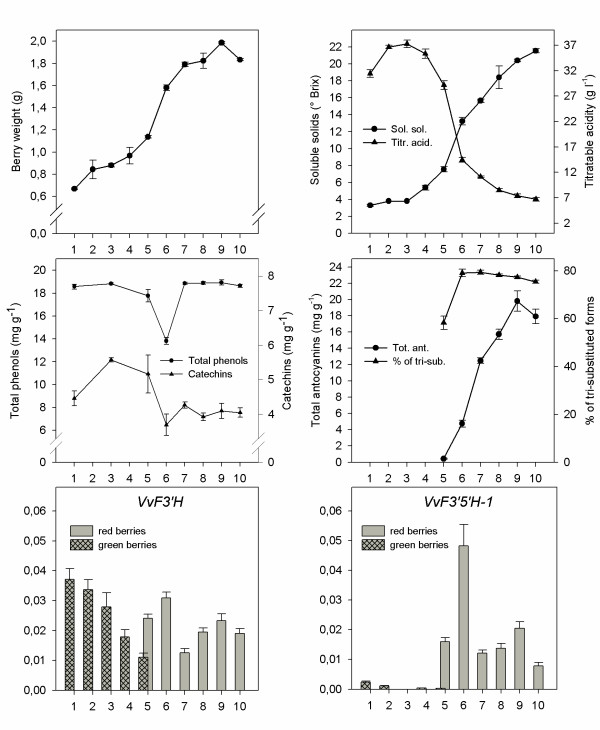
Results: Gene fragments of VvF3'H and VvF3'5'H, that were isolated from Vitis vinifera 'Cabernet Sauvignon' using degenerate primers designed on plant homologous genes, translated into 313 and 239 amino acid protein fragments, respectively, with up to 76% and 82% identity to plant CYP75 cytochrome P450 monooxygenases. Putative function was assigned on the basis of sequence homology, expression profiling and its correlation with metabolite accumulation at ten different ripening stages. At the onset of colour transition, transcriptional induction of VvF3'H and VvF3'5'H was temporally coordinated with the beginning of anthocyanin biosynthesis, the expression being 2-fold and 50-fold higher, respectively, in red berries versus green berries. The peak of VvF3'5'H expression was observed two weeks later concomitantly with the increase of the ratio of delphinidin-/cyanidin-derivatives. The analysis of structural genomics revealed that two copies of VvF3'H are physically linked on linkage group no. 17 and several copies of VvF3'5'H are tightly clustered and embedded into a segmental duplication on linkage group no. 6, unveiling a high complexity when compared to other plant flavonoid hydroxylase genes known so far, mostly in ornamentals.

Conclusion: We have shown that genes encoding flavonoid 3'- and 3',5'-hydroxylases are expressed in any tissues of the grape plant that accumulate flavonoids and, particularly, in skin of ripening red berries that synthesise mostly anthocyanins. The correlation between transcript profiles and the kinetics of accumulation of red/cyanidin- and blue/delphinidin-based anthocyanins indicated that VvF3'H and VvF3'5'H expression is consistent with the chromatic evolution of ripening bunches. Local physical maps constructed around the VvF3'H and VvF3'5'H loci should help facilitate the identification of the regulatory elements of each isoform and the future manipulation of grapevine and wine colour through agronomical, environmental and biotechnological tools.


Figures

Figure 1
Figure 1
Grapevine flavonoid hydroxylase gene fragments isolated from 'Cabernet Sauvignon' genomic DNA. The position of the conserved sites among plant flavonoid hydroxylases, on which the degenerate primers were designed, and the region of the gene fragments sequenced in grapevine are referenced to the gene Ht1 of Petunia × hybrida [GenBank:AF155332] for the flavonoid 3'-hydroxylase (a) and to the Petunia × hybrida GenBank:Z22544 for the flavonoid 3',5'-hydroxylase (b) [41]. The consensus amino acid sequences of grapevine VvF3'H and VvF3'5'H gene fragments are shown along with the position of the intron and (line below the sequence) the variable sites among all the sequenced fragments. The symbol '-' stands for invariable position, '+' underlines two functional domains invariantly found in plant flavonoid hydroxylases, '*' indicates the site of the 23-bp deletion in the VvF3'H-2 sequence.
Figure 2
Figure 2
N-J clustering of Vitis vinifera flavonoid 3',5'-hydroxylase genes. Nucleotide sequences VvF3'5'H-1a, -1b, -1c, -2a and -2b from 'Cabernet Sauvignon' (in bold) were aligned along with ESTs singletons and the resulting tentative consensus (TC45860) for grapevine F3'5'H held at the TIGR grape gene index. ESTs covered both the 5'-end of the VvF3'5'H gene fragments (left) and the 3'-end (right). The tentative consensus has been forced as an outgroup. For each EST, the GenBank ID is reported along with the source genotype and tissue.
Figure 3
Figure 3
The CYP75 clan of plant cyt P450s. The branch containing the CYP75 family is focused on a Neighbor-Joining tree constructed using 670 plant cytochrome P450 monooxygenases. Flavonoid 3'-hydroxylases VvF3'H-1a to -1d and flavonoid 3',5'-hydroxylases VvF3'5'H-1a to -2b that were identified in grapevine are in bold. They split into two lower hierarchical branches that identified the CYP75B (flavonoid 3'-hydroxylases) and CYP75A (flavonoid 3',5'-hydroxylases) sub-families, respectively.
Figure 4
Figure 4
Genetic map of 'Cabernet Sauvignon' LG 6 (a) and LG 17 (b) including the VvF3'5'H and VvF3'H loci. VvF3'H and VvF3'5'H loci (in bold) were mapped with the use of the SSCP markers F3H and F35-1int, respectively. BES markers (underlined) were generated from the end-sequences of BAC clones positive for VvF3'H and VvF3'5'H and mapped using the SSCP technique. VMC, VVI, UDV, VVMD, VVS, and VrZag are microsatellite markers. Numbers on the left indicate the genetic distance between the markers expressed in centiMorgan (cM).
Figure 5
Figure 5
Physical map of the VvF3'H locus. Map of BAC contig ctg253 carrying the VvF3'H-1 and VvF3'H-2 genes and its anchorage to LG17 of 'Cabernet Sauvignon' and V. vinifera consensus genetic maps. BAC clone 5A23 bears the VvF3'H-1 isogene and was included after PCR anchoring onto the contig using marker BES5A23-FM. Names written in horizontal refer to BAC clones and contigs; those written in vertical refer to markers and genes. The orientation of the contig is arbitrary. Genetic and physical distances are not drawn to scale. The presence of a given marker on a BAC clone is highlighted with the symbol '●'. The symbol 'X' stands for lack of amplification of a given marker in the corresponding BAC clone. BAC clones missing any symbol at marker BES5A23-FM were not tested. Physical localisation of VvF3'H-1 and VvF3'H-2 loci is shown in grey boxes.
Figure 6
Figure 6
Haplotypes at the VvF3'5'H-1 and VvF3'5'H-2 loci. SSCP haplotypes at the VvF3'5'H-1 locus and length polymorphic haplotypes at the VvF3'5'H-2 locus were identified in the BAC clones positive for the presence of flavonoid 3',5'-hydroxylase genes on contigs ctg313, ctg871, ctg1320 and ctg2373 (above). Names written in horizontal refer to BAC clones and contigs; those written in vertical refer to gene copies of flavonoid 3',5'-hydroxylases. The relation between the symbol (■ ◆ formula image 
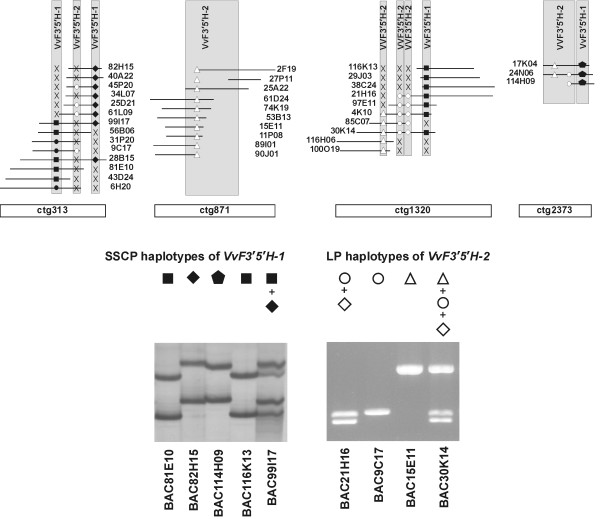
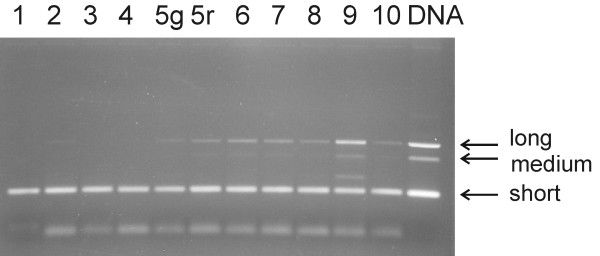
● ◇ ○ △) used in the picture and the corresponding haplotype displayed in a representative BAC clone is shown below. The symbol 'X' stands for lack of the presence of a given haplotype in the corresponding BAC clone.
Figure 7
Figure 7
Integrated genetic and local physical map spanning the complex locus VvF3'5'H on LG6. Contigs were assembled using FPC and BAC clones were further aligned using BES-derived markers. Contigs were anchored to the 'Cabernet Sauvignon' and the V. vinifera consensus genetic maps using cross-referenced SSR markers. The orientation of each contig is arbitrary. Genetic and physical distances are not drawn to scale. Names written in horizontal refer to BAC clones and contigs; those written in vertical refer to markers and genes. The presence of a given marker on a BAC clone is highlighted with a symbol and different SSCP haplotypes for each marker are shown with different symbols (■ ◆ formula image 
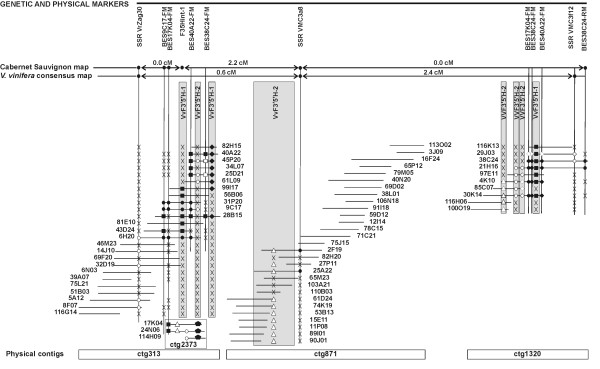
● ◇ ○ △). The symbol 'X' stands for lack of amplification of a given marker in the corresponding BAC clone. BAC clones missing any symbols were not tested with the corresponding marker. Physical localisation of VvF3'5'H-1 and VvF3'5'H-2 loci is shown in grey boxes.
Figure 8
Figure 8
Expression of structural genes of the flavonoid pathway in different tissues. Expression profiles of flavonoid hydroxylase genes were analysed alongside nine major structural genes of the flavonoid pathway in the following tissues: 1, apex and apical leaflet (pale green); 2, apex and apical leaflets (reddish pigmented shoot tips); 3, fully expanded leaves; 4, immature flowers; 5, rootlets; 6, seeds; 7, berry flesh; 8, berry skin (pre-véraison, green); 9, berry skin (post-véraison, red). The actin gene was used as a constitutive gene for the normalisation of cDNA samples.
Figure 9
Figure 9
Transcript profiling of VvF3'H and VvF3'5'H-1 in ripening berries. Ripening curve of V. vinifera 'Merlot' was based on analytical parameters (berry weight, soluble solids, titratable acidity expressed as tartaric acid equivalents, skin total phenols expressed as (+)-gallic acid, skin catechins expressed as (+)-catechin, skin anthocyanins) at the following sampling dates: 1. July 15th, 2. July 29th, 3. August 3rd, 4. August 9th, 5. August 12th, 6. August 24th, 7. September 3rd, 8. September 13th, 9. September 20th, 10. September 28th. Concomitant gene expression of VvF3'H-1 and VvF3'5'H-1 in berry skin was assessed by quantitative RT-PCR and expressed as the ratio between the CT of the gene under study and the CT of the actin gene. Bars represent ± s.e..
Figure 10
Figure 10
Expression of VvF3'5'H-2 during the progress of ripening. Length polymorphic transcripts of VvF3'5'H-2 were detected semi-quantitatively after cDNA samples had been normalised upon actin gene expression, at the sampling dates reported in Fig 9. The short, medium and long transcripts were named according to the fragment size amplified from genomic DNA. At sampling 5, green berries (5g) were kept separated from red berries (5r). PCR amplification on 'Merlot' genomic DNA was loaded in the right extreme lane.

References

    1. Boss PK, Davis C, Robinson SP. Analysis of the expression of anthocyanin pathway genes in developing Vitis vinifera L. cv Shiraz grape berries and the implications for pathway regulation. Plant Physiol. 1996;111:1059–1066. - PMC - PubMed
    1. Kobayashi S, Ishimaru M, Ding CK, Yakushiji H, Goto N. Comparison of UDP-glucose:flavonoid 3-O-glucosyltransferase (UFGT) gene sequences between white grapes (Vitis vinifera) and their spots with red skin. Plant Sci. 2001;160:543–550. doi: 10.1016/S0168-9452(00)00425-8. - DOI - PubMed
    1. Kobayashi S, Ishimaru M, Hiraoka K, Honda C. Myb-related genes of the Kyoho grape (Vitis labruscana) regulate anthocyanin biosynthesis. Planta. 2002;215:924–933. doi: 10.1007/s00425-002-0830-5. - DOI - PubMed
    1. Ford CM, Boss PK, Høi PB. Cloning and characterization of Vitis vinifera UDP-glucose:flavonoid 3-O-glucosyltransferase, a homologue of the enzyme encoded by the maize Bronze-1 locus that may primarily serve to glucosylate anthocyanidins in vivo. J Biol Chem. 1998;273:9224–9233. doi: 10.1074/jbc.273.15.9224. - DOI - PubMed
    1. Holton AT, Cornish EC. Genetics and biochemistry of anthocyanin biosynthesis. Plant Cell. 1995;7:1071–1083. doi: 10.1105/tpc.7.7.1071. - DOI - PMC - PubMed

MeSH terms

LinkOut - more resources