Case Reports
. 2005;28(6):885-902.
doi: 10.1007/s10545-005-0192-9.

S-Adenosylhomocysteine hydrolase deficiency: a second patient, the younger brother of the index patient, and outcomes during therapy

Affiliations
Case Reports

S-Adenosylhomocysteine hydrolase deficiency: a second patient, the younger brother of the index patient, and outcomes during therapy

I Barić et al. J Inherit Metab Dis. 2005.

Abstract

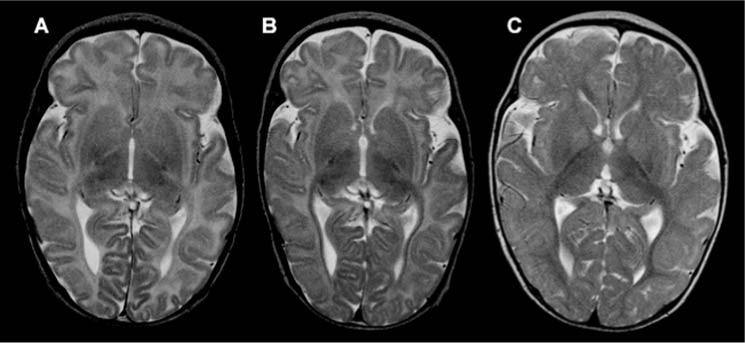
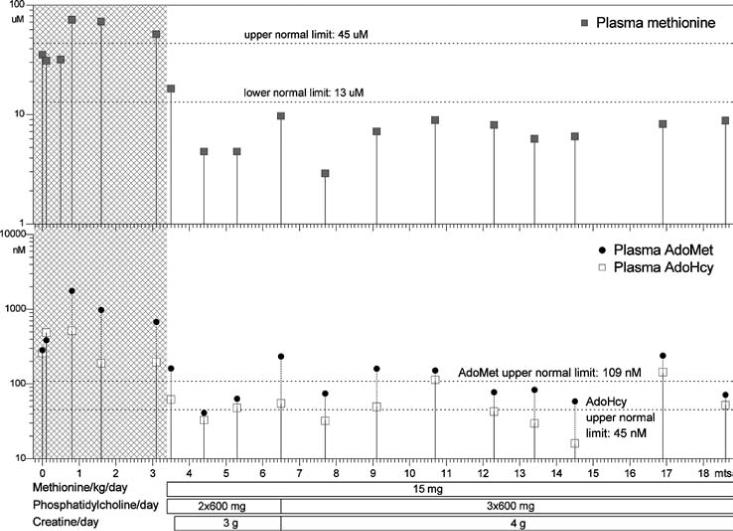
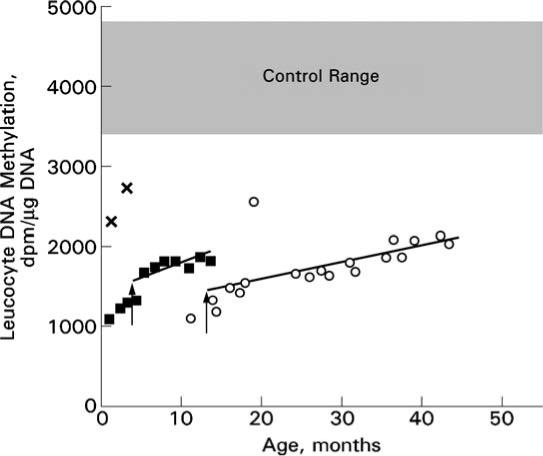
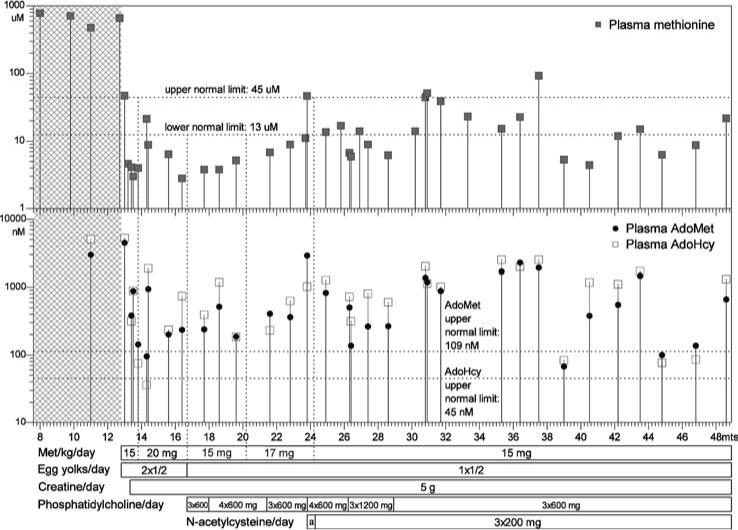
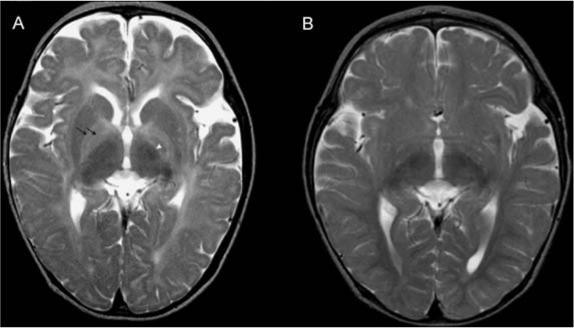
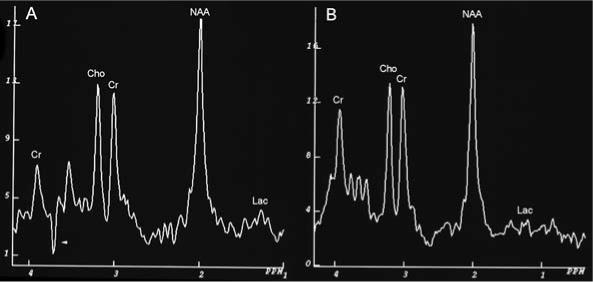
S-Adenosylhomocysteine (AdoHcy) hydrolase deficiency has been proven in a human only once, in a recently described Croatian boy. Here we report the clinical course and biochemical abnormalities of the younger brother of this proband. This younger brother has the same two mutations in the gene encoding AdoHcy hydrolase, and has been monitored since birth. We report, as well, outcomes during therapy for both patients. The information obtained suggests that the disease starts in utero and is characterized primarily by neuromuscular symptomatology (hypotonia, sluggishness, psychomotor delay, absent tendon reflexes, delayed myelination). The laboratory abnormalities are markedly increased creatine kinase and elevated aminotransferases, as well as specific amino acid aberrations that pinpoint the aetiology. The latter include, most importantly, markedly elevated plasma AdoHcy. Plasma S-adenosylmethionine (AdoMet) is also elevated, as is methionine (although the hypermethioninaemia may be absent or nonsignificant in the first weeks of life). The disease seems to be at least to some extent treatable, as shown by improved myelination and psychomotor development during dietary methionine restriction and supplementation with creatine and phosphatidylcholine.


Figures

Figure 1
Figure 1
Brain MRI changes in patient 2. (A) Brain MRI (axial T2) at age 26 days showing diffuse hyperintensity of white matter corresponding to unmyelinated axons. This pattern, with an almost unmyelinated posterior part of internal capsule, would be characteristic for a fetus in the last two weeks of pregnancy or for a newborn in the first days of life. (B) Approximately the same slice at age 3.5 months showed almost no progress in myelination in comparison to the previous examination. In addition, enlargement of subarachnoidal spaces, in particular around frontal and temporal cortex, pointed to mild to moderate brain atrophy. (C) Brain MRI at 10.5 months, about 7 months after start of therapy, revealed a myelination pattern close to the normal age-related pattern (only some intragyral fibers are unmyelinated), pointing to significant acceleration of myelination following therapy. In addition, in comparison with the previous scan, atrophic changes are less evident
Figure 2
Figure 2
Patient 2: plasma methionine, S-adenosylmethionine and S-adenosylhomocysteine concentrations. Ages, in months, are shown on the horizontal axis. Concentrations are shown on the vertical axes in logarithmic scales. The horizontal bars below the graphs show treatment changes. Grey areas indicate time prior to treatment
Figure 3
Figure 3
Global leukocyte DNA methylation in patients 1 and 2 before and during therapy. The extents of incorporation of [3H]dCTP into DNA of packed blood cells at various ages are indicated by open circles for patient 1 and solid squares for patient 2. In this assay, the greater the pre-existing extent of methylation of the DNA, the less the incorporation of radioactivity. Thus, the lower the value observed, the greater is the extent of methylation of the sample being studied. The vertical arrows interrupting the points for patient 1 at age 12.8 months and those for patient 2 at age 3.4 months indicate the start of dietary methionine restriction. Analyses were carried out in four groups determined by the availability of samples. Group 1 contained the sample from patient 1, age 11 months; group 2, samples from patient 1, ages 13.8−18.6 months; group 3, samples from patient 1, ages 23.8−31.6 months and patient 2, ages 0.8−3.4 months; group 4, samples from patient 1, ages 30.9−43.4 months (including repeat assays of the samples from 30.9 and 31.6 months) and patient 2, ages 4.4−13.5 months. Because the value for a given sample may vary slightly in serial analyses, to ensure maximum comparability the sample from patient 1 at age 17.7 months was reassayed along with groups 3 and 4. All values from these assays were then multiplied by a correction factor of 0.87699, calculated to make the corrected values for the sample from patient 1 at 17.7 months the same for all groups. Corrected values are plotted. The regression lines shown for each patient were calculated starting with the onset of dietary methionine restriction. Controls were either infants, ages 1 or 3 months (corrected values 2263 and 2730, respectively, assayed with group 3, indicated by ×'s), or samples from older children, ages unspecified, whose samples were assayed with either group 1 (n = 4) or group 2 (n = 3). The means for these two sets of control samples were not statistically different, so the resulting overall control value (4125 ± 714 SD; n = 7) is shown as the grey area between the mean + 1 SD (4839) and the mean − 1 SD (3411)
Figure 4
Figure 4
Patient 1: plasma methionine, S-adenosylmethionine and S-adenosylhomocysteine concentrations. The plot is drawn in same manner as that in Figure 2. Area marked by ‘a’ indicates the time span when the patient received N-acetylcysteine at a dose of 3 × 100 mg/day
Figure 5
Figure 5
MRI studies (axial T2) of the brain of patient 1 at ages (A) 12.7 months, before therapy, and (B) 19.6 months, after 7 months of treatment. (A) Myelination is present only in the posterior part of the internal capsule (arrowhead). Note the clear delineation of globi pallidi because of unmyelinated lateral and medial lamina (double black arrow). The pattern of myelination corresponds to an age of 2−3 months. (B) There is marked improvement, with nearly normal myelinization for this age. There is only slight hyperintensity in peritrigonal white matter and in cortical U-fibres in frontal and temporal gyri. Note persistent, mildly to moderately enlarged subarachnoid spaces in the frontal and temporal lobes
Figure 6
Figure 6
Proton MR spectra of occipital subcortical white matter of patient 1 at ages 12.7 months, (A) before therapy, and (B) 19.6 months, after 7 months of treatment. Cr, creatine/phosphocreatine; Cho, choline; NAA, N-acethylaspartate; Lac, lactate. The Cho/Cr ratios in both spectra are abnormally low: 1.03. and 1.10, respectively. The normal ratio for this age span is about 1.81 ± 0.16 (Filippi et al 2003). In the spectrum at 12.7 months there is an unresolved inverted peak at 3.78 ppm (arrowhead). There is a small increase in the lactate peak in the MR spectrum at 12.7 months

References

    1. Allen RH, Stabler SP, Lindenbaum J. Serum betaine, N,N-dimethylglycine and N-methylglycine levels in patients with cobalamin and folate deficiency and related inborn errors of metabolism. Metabolism. 1993;42:1448–1460. - PubMed
    1. Barić I, Fumić K, Glenn B, et al. S-Adenosylhomocysteine hydrolase deficiency in a human: a genetic disorder of methionine metabolism. Proc Natl Acad Sci USA. 2004;101:4234–4239. - PMC - PubMed
    1. Bradford MM. A rapid and sensitive method for the quantitation of microgram quantities of protein utilizing the principle of protein–dye binding. Anal Biochem. 1976;72:248–254. - PubMed
    1. Brosnan JT, Jacobs RL, Stead LM, Brosnan ME. Methylation demand: a key determinant of homocysteine metabolism. Acta Biochimica Polonica. 2004;51:405–413. - PubMed
    1. Capdevila A, Wagner C. Measurement of plasma S-adenosylmethionine and S-adenosylhomocysteine as their fluorescent isoindoles. Analyt Biochem. 1998;264:180–184. - PubMed

Publication types

MeSH terms