. 2006 Jan 25;26(4):1065-76.
doi: 10.1523/JNEUROSCI.3347-05.2006.

Splice variants of the NR1 subunit differentially induce NMDA receptor-dependent gene expression

Affiliations

Splice variants of the NR1 subunit differentially induce NMDA receptor-dependent gene expression

John Bradley et al. J Neurosci. .

Abstract

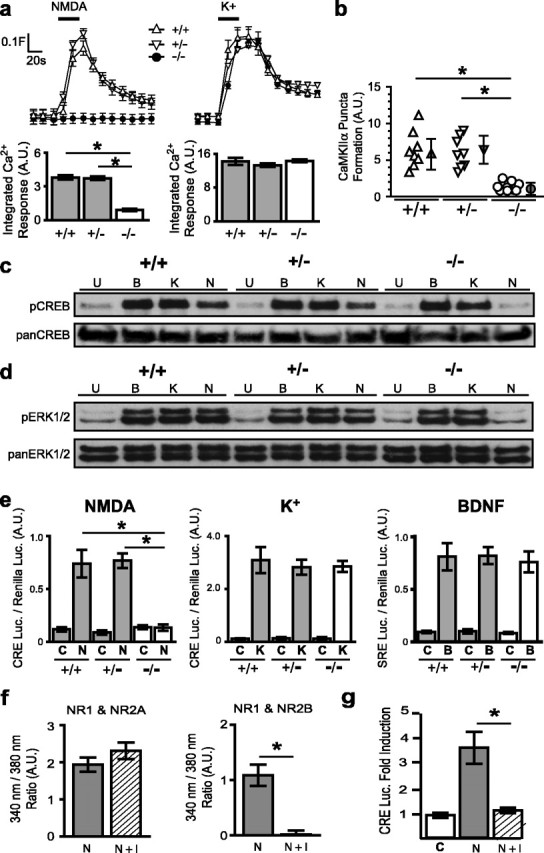
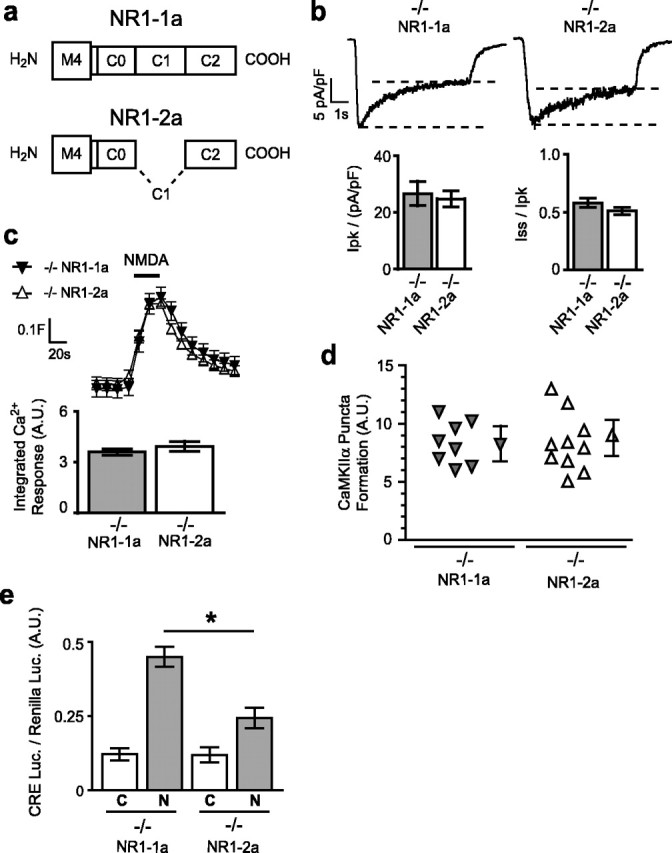
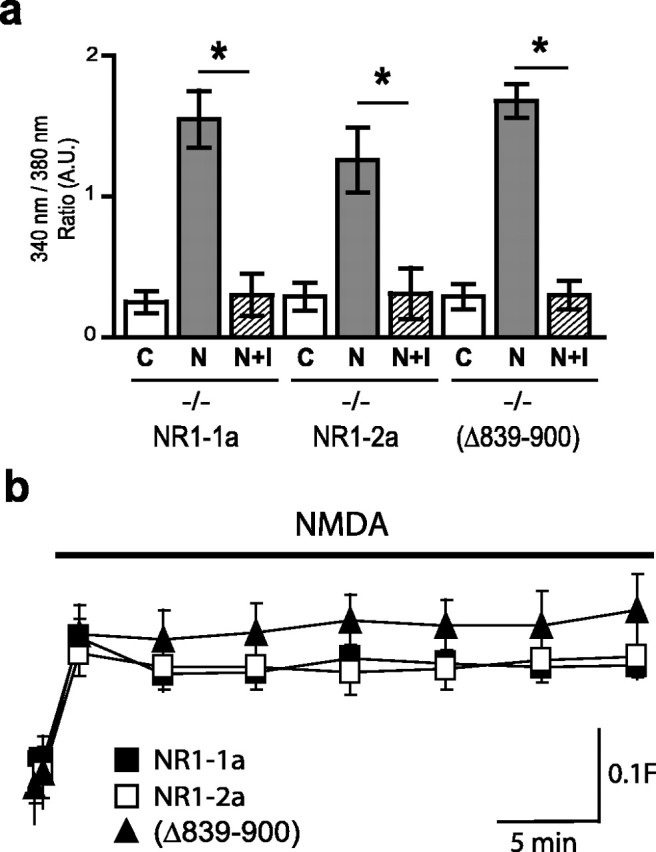
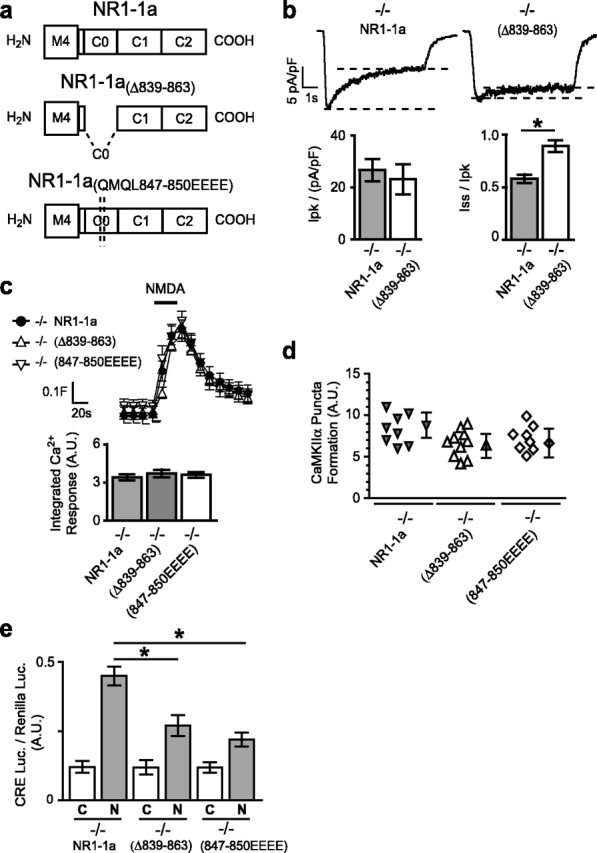
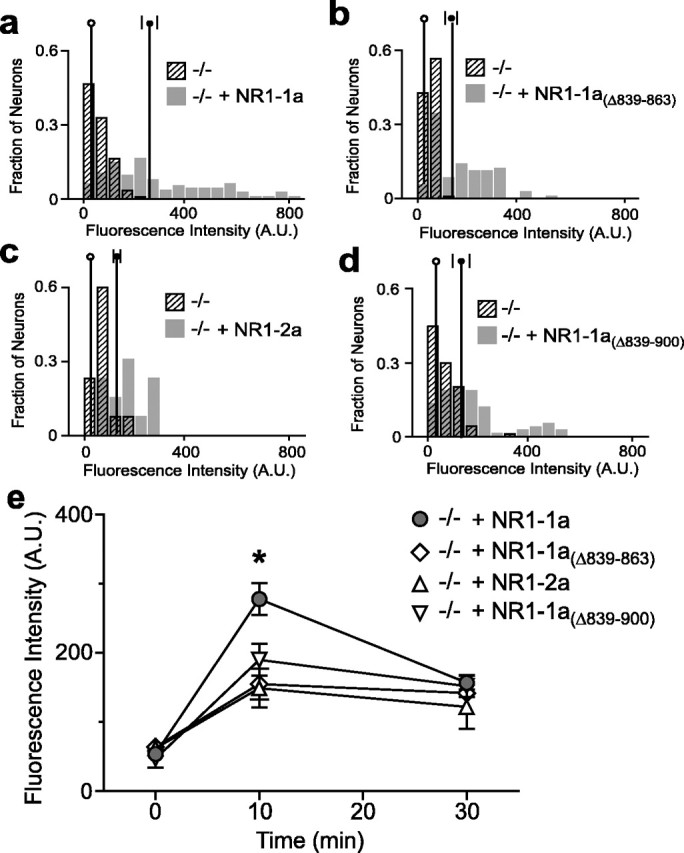
Subunits of the NMDA receptor (NMDAR) associate with many postsynaptic proteins that substantially broaden its signaling capacity. Although much work has been focused on the signaling of NR2 subunits, little is known about the role of the NR1 subunit. We set out to elucidate the role of the C terminus of the NR1 subunit in NMDAR signaling. By introducing a C-terminal deletion mutant of the NR1 subunit into cultured neurons from NR1(-/-) mice, we found that the C terminus was essential for NMDAR inactivation, downstream signaling, and gene expression, but not for global increases in intracellular Ca2+. Therefore, whereas NMDARs can increase Ca2+ throughout the neuron, NMDAR-dependent signaling, both local and long range, requires coupling through the NR1 C terminus. Two major NR1 splice variants differ by the presence or absence of a C-terminal domain, C1, which is determined by alternative splicing of exon 21. Analysis of these two variants showed that removal of this domain significantly reduced the efficacy of NMDAR-induced gene expression without affecting receptor inactivation. Thus, the NR1 C terminus couples to multiple downstream signaling pathways that can be modulated selectively by RNA splicing.


Figures

Figure 1.
Figure 1.
NMDAR signaling is selectively abolished in NR1−/− cortical neurons. a, Measurement of [Ca2+]i with fura-2 in NR1+/+, NR1+/−, and NR1−/− neurons. Neurons were stimulated (black bar) with NMDA (30 μm, 30 s) (left) or K+ (55 mm, 30 s) (right). Traces show mean± SEM fura-2 ratio (340/380 nm) for 25 neurons per experiment aligned at the timestamp of agonist addition. In this and subsequent figures, the baseline is cropped for presentation. Column graphs show integrated area of [Ca2+]i response to NMDA (left) and K+ (right) for each NR1 genotype; each condition represents the mean ± SEM for at least 75 neurons from at least four embryos (see Materials and Methods). b, CaMKIIα puncta formation in neurites of cortical neurons of different NR1 genotypes (see Materials and Methods). *p < 0.05 by ANOVA for at least eight neurites from four different neurons per condition. c, d, Western blot analysis using anti-phosphoCREB (Ser-133) and anti-phosphoERK (Thr-183, Tyr-185). NMDA (N; 30 μm) induced phosphorylation of both CREB and ERK in NR1+/+ and NR1+/− neurons but not in NR1−/− neurons. The extent of K+-induced (K; 55 mm) and BDNF-induced (B; 50 ng/ml) CREB and ERK phosphorylation was similar in all NR1 genotypes. Neurons were stimulated for 15 min (pCREB) or for 5 min (pERK); U represents unstimulated/wash control. The blots are representative of data from three independent cell preparations. e, Gene expression in different NR1 genotypes as measured by luciferase reporter assays. NMDA (30 μm, 8 h) did not induce CRE-luciferase expression in NR1−/− neurons but significantly increased CRE-luciferase expression in NR1+/+ and NR1+/− neurons (n = 4). The induction of CRE-luciferase to K+ was not significantly different among NR1 genotypes (n = 5), and the induction of SRE-luciferase to BDNF was not significantly different across NR1 genotypes (n = 3). *p < 0.01, unpaired t test. f, Ifenprodil (I; 10 μm) did not inhibit NMDA-induced [Ca2+]i responses in HEK293T cells transfected with NR1–1a and NR2A (left) but completely inhibited NMDA-induced [Ca2+]i responses in HEK293T cells transfected with NR1–1a and NR2B. g, In NR1+/− neurons, 10 μm ifenprodil blocked NMDA-induced CRE-dependent luciferase expression. *p < 0.01, unpaired t test. A.U., Arbitrary units; C, control.
Figure 2.
Figure 2.
Reconstitution of NMDAR signaling in NR1−/− neurons. a, Sample traces of whole-cell currents induced by NMDA (100 μm for 5 s); the sample traces here and in subsequent figures are the average of at least 10 responses over 10 min. Quantification of the normalized peak [Ipk/(pA/pF)] or steady-state (Iss/Ipk) current revealed no significant difference between NR1−/− neurons transfected with NR1–1a and NR1+/− neurons. b, Transfection of NR1−/− neurons with the NR1–1a subunit reconstituted [Ca2+]i responses to NMDA with profiles comparable with NMDA-induced [Ca2+]i responses in NR1+/+ and NR1+/− neurons. Quantification of integrated area of [Ca2+]i response revealed no significant difference between NR1−/− neurons transfected with NR1–1a and NR1+/+ and NR1+/− neurons; each condition represents the mean ± SEM for at least 18 neurons from at least four embryos. c, NMDA (30 μm) did not induce CaMKIIα puncta formation in NR1−/− neurons, but formation of GFP-CaMKIIα puncta during stimulation with NMDA was reproducibly observed in the neurites of NR1−/− neurons transfected with NR1–1a and was comparable with NR1−/+ neurons. d, Reconstitution of NMDA-induced CREB phosphorylation in NR1−/− neurons, as measured by immunocytochemistry. Mean ± SEM for at least 44 neurons from four independent experiments. e, NMDA (30 μm, 8 h) did not induce CRE-luciferase expression in NR1−/− neurons but produced a 3.6-fold induction of CRE-luciferase expression in NR1−/− neurons transfected with NR1–1a. Mean ± SEM for six independent experiments. f, Survival analysis in which cortical neurons of NR1+/− mice (triangles; 10, 080 neurons) and NR1−/− mice (inverted triangles; 13, 123 neurons) were transfected with EGFP and counted at 24 h intervals for 6 d. The hazard or risk of death among neurons from NR1−/− mice transfected with NR1–1a and EGFP (filled circles; 11, 574) was comparable with that observed with neurons from NR1+/− mice and above the suppressed levels in untransfected NR1−/− neurons. *p < 0.05, log-rank test. A.U., Arbitrary units; C, control; N, NMDA.
Figure 3.
Figure 3.
The NR1 C terminus is required for gene expression. a, Domains of the C terminus of the NR1–1a subunit and a C-terminal deletion mutant, NR1–1aΔ839–900; M4 refers to the most C-terminal transmembrane domain. b, Sample traces of whole-cell currents induced by NMDA (100 μm for 5 s) for NR1–1a and NR1–1aΔ839–900. Quantification of the normalized peak current [bottom left; Ipk/(pA/pF)] revealed no significant difference between NR1−/− neurons transfected with NR1–1a and NR1–1aΔ839–900. In contrast, steady-state currents (Iss/Ipk) were significantly higher in NR1−/− neurons transfected with NR1–1aΔ839–900 than those with NR1–1a, consistent with reduced inactivation. c, Reconstituted [Ca2+]i responses to NMDA have similar profiles in NR1−/− neurons transfected with NR1–1aΔ839–900 or with NR1–1a, but the pore mutant (NR1–1aN616R) does not reconstitute [Ca2+]i responses (mean ± SEM fura-2 ratio for at least 8 neurons). The column graphs show the quantified integrated area of [Ca2+]i responses to NMDA; each condition represents the mean ± SEM for at least 50 neurons from at least four embryos. d, No significant difference was observed in NMDA-induced puncta formation by GFP-CaMKIIα in neurons transfected with NR1–1aΔ839–900 or with NR1–1a, but no GFP-CaMKIIα puncta formation was observed in neurons transfected with the pore mutant NR1–1aN616R. e, CRE-dependent luciferase gene expression is abolished in NR1−/− neurons transfected with NR1–1aΔ839–900 and with NR1–1aN616R. Mean ± SEM for at least four independent experiments. *p < 0.01, unpaired t test. A.U., Arbitrary units; C, control; N, NMDA.
Figure 4.
Figure 4.
Splice variants NR1–1a and NR1–2a differentially induce gene expression. a, Domains of the NR1 C terminus for NR1–1a and NR1–2a. b, Sample traces of whole-cell currents induced by NMDA (100 μm for 5 s) for NR1–1a and NR1–2a; quantification of the normalized peak [Ipk/(pA/pF)] and steady-state (Iss/Ipk) currents revealed no significant difference between NR1−/− neurons transfected with NR1–1a and NR1–2a. c, Reconstituted [Ca2+]i responses to NMDA have similar profiles in NR1−/− neurons transfected with NR1–1a or with NR1–2a (traces, mean ± SEM fura-2 ratio at least 14 neurons). Column graphs show the quantification of integrated area of [Ca2+]i responses; each condition represents the mean ± SEM for at least 14 neurons from at least four embryos. d, No significant difference was observed in NMDA-induced puncta formation by GFP-CaMKIIα in neurons transfected with NR1–1a or NR1–2a. Mean ± SEM for at least four experiments. e, CRE-dependent luciferase gene expression was significantly less in NR1−/− neurons transfected with NR1–2a than with NR1–1a. Mean ± SEM for at least four independent experiments. A.U., Arbitrary units; C, control; N, NMDA.
Figure 5.
Figure 5.
Differences in gene expression are not explained by NR2 subunits or by steady-state Ca2+ levels. a, NMDA-induced [Ca2+]i responses in NR1−/− neurons transfected with NR1–1a, NR1–2a, and NR1–1aΔ839–900 were all inhibited to a similar extent by ifenprodil. Mean ± SEM for at least three independent experiments. *p < 0.01, unpaired t test. b, NMDA-induced steady-state Ca2+ levels among NR1 subunits show no significant differences after 30 min (mean ± SEM fura-2 ratio for at least 14 neurons). C, Control; N, NMDA.
Figure 6.
Figure 6.
Deletion of the C0 domain or mutation of a single CaM-binding site significantly reduces gene expression. a, C-terminal domains of NR1–1a, NR1–1aΔ839–863, and NR1–1a(QMQL847–850EEEE). b, Sample traces of whole-cell currents induced by NMDA (100 μm for 5 s) for neurons transfected with NR1–1a or NR1–1aΔ839–863. Quantification of the normalized peak current revealed no significant difference between NR1−/− neurons transfected with NR1–1a or NR1–1aΔ839–863; steady-state currents were higher for NR1–1aΔ839–863 than for NR1–1a because of reduced inactivation. c, Reconstituted [Ca2+]i responses to NMDA have similar profiles in NR1−/− neurons transfected with NR1–1aΔ839–863, NR1–1a(QMQL847–850EEEE), or NR1–1a (mean ± SEM fura-2 ratio for 12 neurons). The column graphs show the quantification of integrated area of [Ca2+]i responses; each condition represents the mean ± SEM for at least 12 neurons from at least four embryos. d, No significant difference was observed in NMDA-induced puncta formation by GFP-CaMKIIα in neurons transfected with NR1–1a, NR1–1aΔ839–863, or NR1–1a(QMQL847–850EEEE). e, NMDA-induced CRE-dependent luciferase gene expression is significantly reduced in NR1−/− neurons transfected with NR1–1aΔ839–863 or NR1–1a(QMQL847–850EEEE). Mean ± SEM for at least four independent experiments. *p < 0.01, unpaired t test. A.U., Arbitrary units; C, control; N, NMDA.
Figure 7.
Figure 7.
Domains in the NR1 C terminus control CREB phosphorylation (Ser-133). NR1−/− neurons were transfected with mRFP and NR1–1a (a), NR1–1aΔ839–863 (b), NR1–2a (c), or NR1–1aΔ839–900 (d) and stimulated for 10 min with NMDA (30 μm). pCREB-133 levels were measured blind as the average intensity of phosphoCREB staining in the nucleus (identified by Hoechst stain) of transfected neurons (mRFP) and corrected for background with an acellular region (see Materials and Methods). Average intensity values for at least 60 neurons per condition from at least four NR1−/− embryos are plotted as normalized frequency histograms. The vertical lines are the mean ± SEM for each population (open circle, empty vector; filled circle, NR1 construct). e, Time course reveals that NR1−/− neurons transfected with NR1–1a show significantly more NMDA-induced CREB phosphorylation at 10 min than those transfected with NR1–1aΔ839–863, NR1–2a, or NR1–1aΔ839–900. At 30 min, levels of CREB phosphorylation are similar. *p < 0.05, ANOVA. A.U., Arbitrary units; C, control; N, NMDA.

References

    1. Akyol Z, Bartos JA, Merrill MA, Faga LA, Jaren OR, Shea MA, Hell JW (2004). Apo-calmodulin binds with its C-terminal domain to the N-methyl-d-aspartate receptor NR1 C0 region. J Biol Chem 279:2166–2175. - PubMed
    1. Arrasate M, Finkbeiner S (2005). An automated microscope system for determining factors that predict neuronal fate. Proc Natl Acad Sci USA 102:3840–3845. - PMC - PubMed
    1. Arrasate M, Mitra S, Schweitzer ES, Segal MR, Finkbeiner S (2004). Inclusion body formation reduces levels of mutant huntingtin and the risk of neuronal death. Nature 431:805–810. - PubMed
    1. Bading H, Ginty DD, Greenberg ME (1993). Regulation of gene expression in hippocampal neurons by distinct calcium signaling pathways. Science 260:181–186. - PubMed
    1. Berridge MJ (1998). Neuronal calcium signaling. Neuron 21:13–26. - PubMed

Publication types

MeSH terms

LinkOut - more resources