Comparative Study
. 2006 Jan 25;26(4):1077-87.
doi: 10.1523/JNEUROSCI.2834-05.2006.

Involvement of the CA3-CA1 synapse in the acquisition of associative learning in behaving mice

Affiliations
Comparative Study

Involvement of the CA3-CA1 synapse in the acquisition of associative learning in behaving mice

Agnès Gruart et al. J Neurosci. .

Abstract

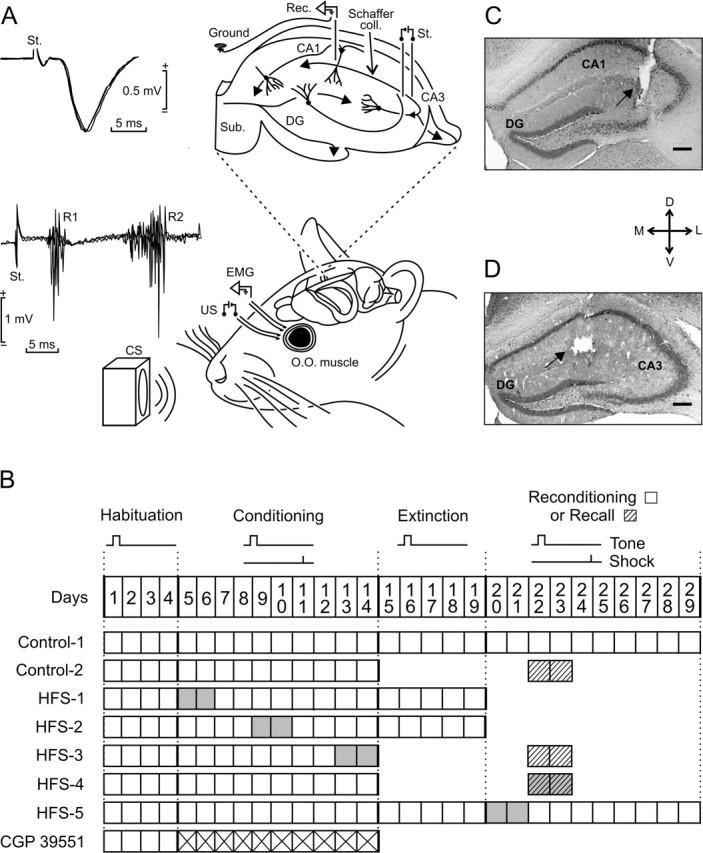
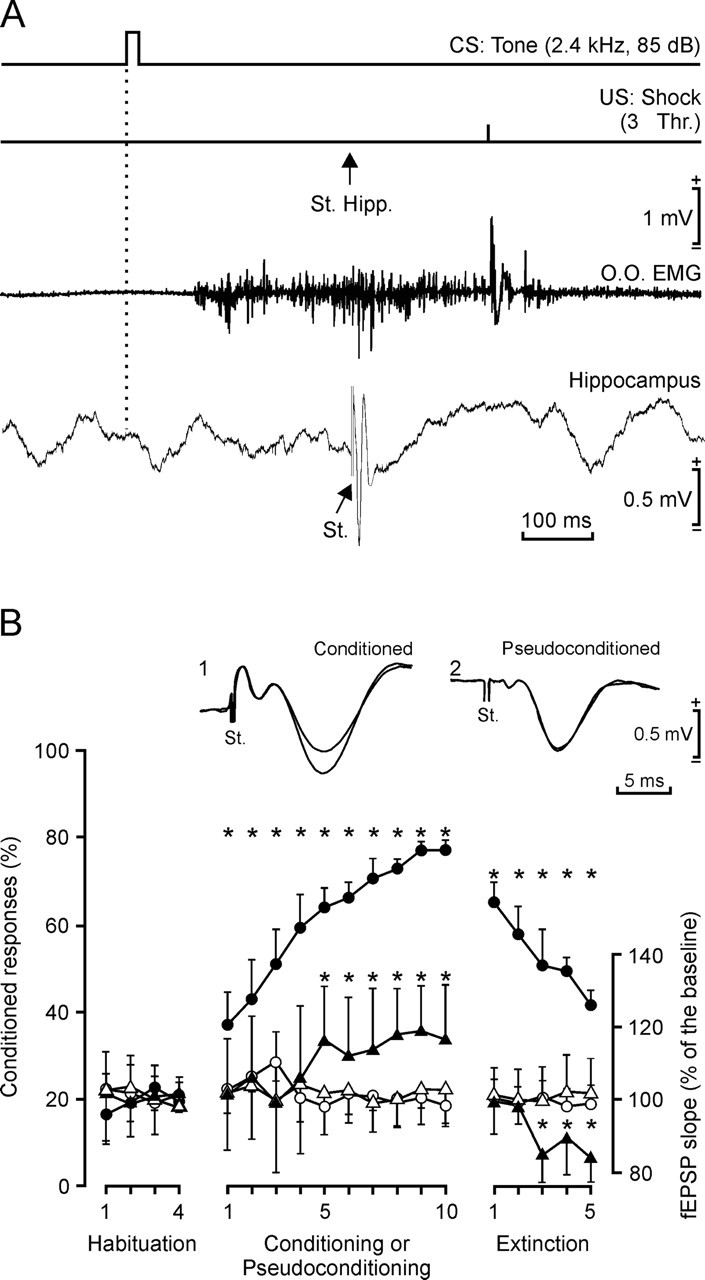
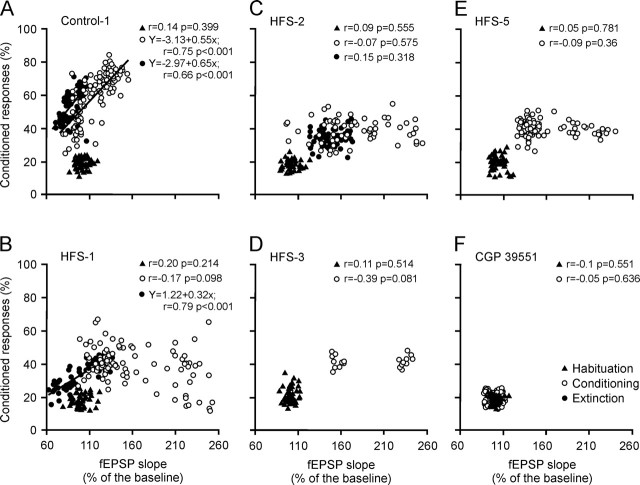
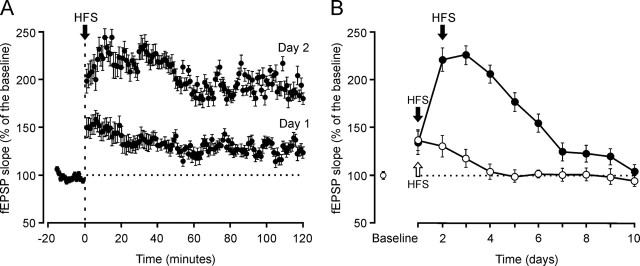
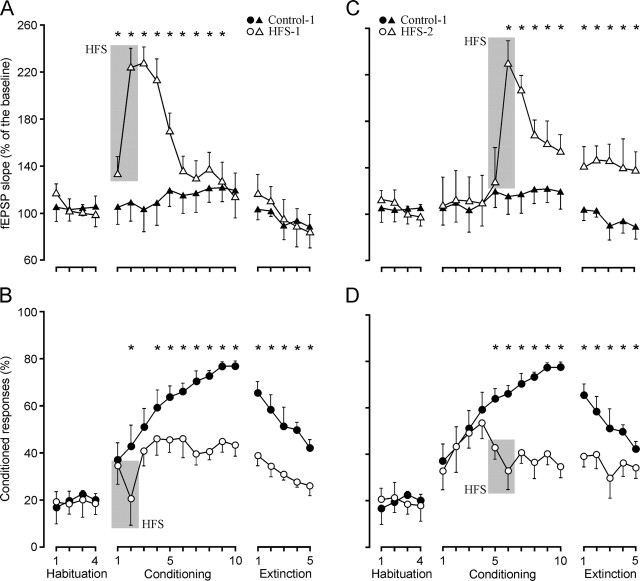
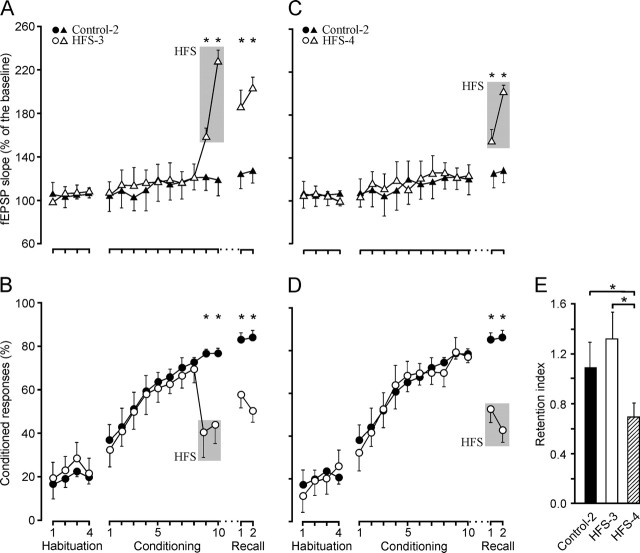
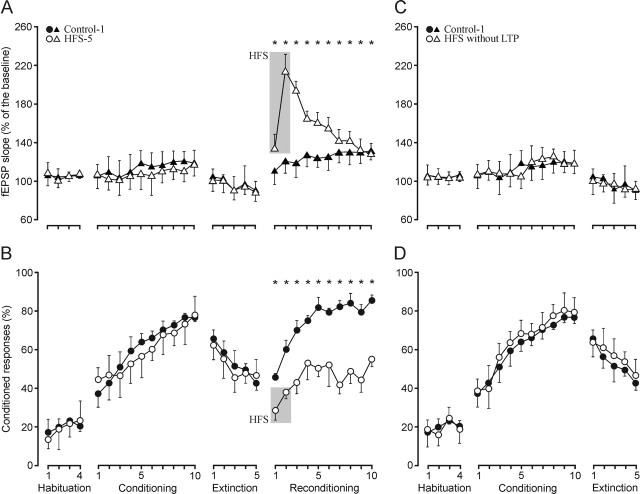
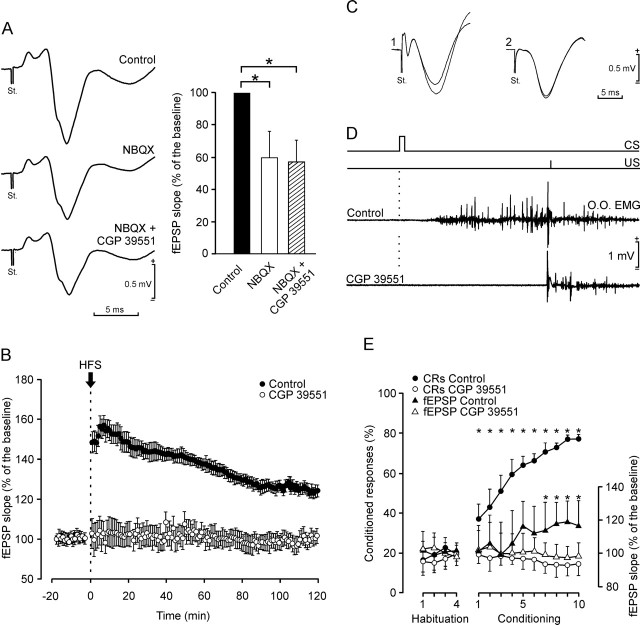
One of the brain sites more directly related with learning and memory processes is the hippocampus. We recorded, in conscious mice, the activity-dependent changes taking place at the hippocampal CA3-CA1 synapse during the acquisition, extinction, recall, and reconditioning of an associative task. Mice were classically conditioned to evoke eyelid responses using a trace [conditioned stimuli (CS), tone; unconditioned stimuli (US), shock] paradigm. A single electrical pulse presented to the Schaffer collateral-commissural pathway during the CS-US interval evoked a monosynaptic field EPSP (fEPSP) at ipsilateral CA1 pyramidal cells. The slope of evoked fEPSPs increased across conditioning sessions and decreased during extinction, being linearly related to learning evolution. In contrast, fEPSPs were not modified when evoked in control mice in the absence of a conditioning protocol. Long-term potentiation (LTP) evoked by high-frequency stimulation of Schaffer collaterals prevented acquisition, extinction, recall, or reconditioning, depending on the moment when it was triggered. Learning and memory impairments evoked by LTP induction resulted probably from the functional saturation of the CA3-CA1 synapse, although an additional disturbance of the subsequent information transfer toward postsynaptic circuits cannot be discarded. CGP 39551 [(E)-(+/-)-2-amino-4-methyl-5-phosphono-3-pentenoic acid ethyl ester] (an NMDA antagonist) prevented LTP induction in behaving mice, as well as the acquisition of an eyelid learned response, and the synaptic changes taking place at the CA3-CA1 synapse across conditioning. In conclusion, the responsivity of the CA3-CA1 synapse seems to be modulated during associative learning, and both processes are prevented by experimental LTP or NMDA-receptor inactivation. Our results provide evidence of a relationship between activity-dependent synaptic plasticity and associative learning in behaving mice.


Figures

Figure 1.
Figure 1.
Experimental design. A, EMG recording electrodes were implanted in the orbicularis oculi (O.O.) muscle of the upper left eyelid. Bipolar stimulating electrodes were implanted on the ipsilateral supraorbitary branch of the trigeminal nerve for presentation of US. For classical conditioning of eyelid responses, we used a tone (20 ms; 2.4 kHz; 85 dB) as a CS. The loudspeaker was located 30 cm from the animal’s head. As shown at the top right diagram, animals were also implanted with stimulating and recording electrodes aimed to activate CA3–CA1 synapses of the right (contralateral) hippocampus. The two superimposed recordings at the top left illustrate the extracellular synaptic field potential recorded (Rec.) at the stratum radiatum of the CA1 area after electrical stimulation (St.) of the Schaffer collaterals. Superimposed recordings at the bottom left correspond to the blink reflex evoked at the O.O. muscle by the electrical stimulation of the trigeminal nerve. Note the two short (R1) and long (R2) latency components characterizing the blink reflex in mammals. B, Main experimental groups. All animals received four habituation and 10 conditioning sessions. In addition, some groups received five extinction or two recall (dashed boxes) sessions. Two groups (Control-1 and HFS-5) were reconditioned for 10 d. The CGP 39551 group received this drug daily during the 10 conditioning sessions (crossed boxes). Gray boxes indicate when the HFS sessions were applied. C, D, Photomicrographs illustrating the location of stimulating (C) and recording (D) sites (arrows). Scale bars: C, D, 200 μm. D, Dorsal; L, lateral; M, medial; V, ventral; DG, dentate gyrus; Sub, subiculum.
Figure 2.
Figure 2.
Learning curves and evolution of the synaptic field potential for control and pseudoconditioned groups. A, A schematic representation of the conditioning paradigm, illustrating CS and US stimuli, and the moment at which a single pulse (100 μs; square; biphasic) was presented to Schaffer collaterals (St. Hipp.). An example of an EMG recording from the orbicularis oculi (O.O.) muscle obtained from the seventh conditioning session is illustrated, as well as an extracellular recording of hippocampal activity from the same animal, session, and trial. Note the fEPSP evoked by the single pulse presented to Schaffer collaterals. B, At the top are illustrated fEPSPs recorded in the CA1 area after a single pulse presented to the ipsilateral Schaffer collaterals 300 ms after CS presentation, in a conditioned (1) and in a pseudoconditioned (2) animal, during the 1st and 10th conditioning sessions. The graphs at the bottom show the evolution of the percentage (%) of CRs during the successive sessions for conditioned (control, filled circles) and pseudoconditioned (circles) groups. Mean percentage values are followed by ±SD. Differences between conditioned and pseudoconditioned groups were statistically significant for all conditioning sessions (F(18, 162) = 192.7; *p < 0.001). Evolution of the fEPSP slope is also indicated for conditioned (black triangles) and pseudoconditioned (open triangles) groups, expressed as the percentage change with respect to mean values collected during the four habituation sessions. Differences between conditioned and pseudoconditioned groups were statistically significant from the 5th to the 10th conditioning sessions and from the third to the fifth extinction sessions (F(18, 162) = 48.2; *p < 0.001).
Figure 3.
Figure 3.
Quantitative analysis of the relationships between percentage of conditioned responses and fEPSP slopes for the different experimental groups during habituation, conditioning, reconditioning, and extinction sessions. A–F, Data collected from controls (A), HFS-1 (B), HFS-2 (C), HFS-3 (D), HFS-5 (E), and CGP 39551 (F) groups. Each point represents the mean value collected from a single animal during the corresponding session. Data collected from habituation (black triangles), conditioning or reconditioning (open circles), and extinction (filled circles) sessions are illustrated. Represented data for conditioning and extinction sessions correspond exclusively to those collected after HFS sessions. Regression lines and their corresponding equations are included only for coefficients of correlation (r > 0.6). The p values for each regression analysis are always indicated.
Figure 4.
Figure 4.
LTP induction in the CA1 area after electrical stimulation of the Schaffer collaterals. A, LTP induction in the same animal. The HFS was presented for two consecutive days. The fEPSP is given as a percentage of the baseline (100%) slope. To obtain a baseline, animals were stimulated every 5 s for 15 min at Schaffer collaterals. After HFS, the same stimulus was presented at the same rate (12 per min) for 2 h. B, LTP induction in two groups of animals (n = 5 each). One group of animals received HFS trains for only 1 d (open arrow and circles), whereas the other group was stimulated for 2 d (black arrows and filled circles). To check LTP evolution, animals were stimulated daily at Schaffer collaterals every 5 s for 15 min. Values are expressed as mean ± SD.
Figure 5.
Figure 5.
Learning curves and evolution of the synaptic field potential for controls and groups HFS-1 and HFS-2. A, B, fEPSP slope (A, open triangles) and percentage (B, circles) of conditioned responses from animals receiving HFS (gray lane) before the first two conditioning sessions (HFS-1 group). For comparative purposes, data collected from the control group are also indicated (A, fEPSP, black triangles; B, percentage of responses, filled circles). As a result of the LTP evoked by HFS, the fEPSP slope for the HFS-1 group was significantly larger than baseline values during the first 9 d of conditioning (F(18, 162) = 32.8; *p < 0.001). The acquisition and extinction curves presented by the HFS-1 group were also significantly different from those of controls (F(18, 162) = 15; *p < 0.001). C, D, fEPSP slope (C, open triangles) and percentage (D, circles) of conditioned responses from animals receiving HFS (gray lane) before the fifth and sixth conditioning sessions (HFS-2 group), compared with controls (C, fEPSP, black triangles; D, percentage of responses, filled circles). As a result of the LTP evoked by HFS, the fEPSP slope was significantly larger than baseline values (100%) during the last 5 d of conditioning (F(14, 126) = 7.58; *p < 0.001). From the two HFS sessions onward, the acquisition (and extinction) curves presented by the HFS-2 group were significantly (F(14, 126) = 43.2; *p < 0.001) different from those of controls. Values are expressed as mean ± SD.
Figure 6.
Figure 6.
Learning curves and evolution of the synaptic field potential for controls and groups HFS-3 and HFS-4. A, B, fEPSP slope (A, open triangles) and percentage (B, circles) of conditioned responses from animals receiving HFS (gray lane) before the last two conditioning sessions (HFS-3 group). For comparative purposes, data collected from the control group are also indicated (A, fEPSP, black triangles; B, percentage of responses, filled circles). As a result of the LTP evoked by HFS, the fEPSP slope for the HFS-3 group was significantly larger than baseline values during the last 2 d of conditioning and the two recall sessions (F(7, 63) = 16.8; *p < 0.001). After the two HFS sessions, the learning curves presented by the HFS-3 group were significantly (F(7, 63) = 162.4; *p < 0.001) different from those of controls. C, D, fEPSP slope (C, open triangles) and percentage (D, circles) of conditioned responses from animals receiving HFS (gray lane) before the two recall sessions (HFS-4 group), compared with controls (C, fEPSP, black triangles; D, percentage of responses, filled circles). As a result of the LTP evoked by HFS, the fEPSP slope was significantly larger than baseline values during the two recall sessions (F(5, 45) = 8.37; *p < 0.001). In addition, the learning curves presented by the HFS-4 group were significantly (F(5, 45) = 16.9; *p < 0.001) different from those of controls during the two recall sessions. E, Retention index for controls and HFS-3 and HFS-4 groups. The retention index represents the ratio between the mean percentage of CRs during the last two conditioning sessions and the two recall sessions. The retention index was significantly lower for the HFS-4 group as compared with controls and the HFS-3 group (*p ≤ 0.01). Values are expressed as mean ± SD.
Figure 7.
Figure 7.
Learning curves and evolution of the synaptic field potential for controls, group HFS-5, and animals unable to evoke LTP after two sessions of HFS. A, B, fEPSP slope (A, open triangles) and percentage (B, circles) of conditioned responses from animals receiving HFS (gray lane) before the last two reconditioning sessions (HFS-5 group). For comparative purposes, data collected from the control group are also indicated (A, fEPSP, black triangles; B, percentage of responses, filled circles). As a result of the LTP evoked by HFS, the fEPSP slope for the HFS-5 group was significantly larger than baseline values during the 10 d of reconditioning (F(13, 117) = 6.09; *p < 0.01). After the two HFS sessions, the learning curves presented by the HFS-5 group were significantly (F(13, 117) = 207.4; *p < 0.001) different from those of controls during the 10 conditioning sessions. C, D, fEPSP slope (C, open triangles) and percentage (D, circles) of conditioned responses from animals (n = 17) receiving two HFS sessions, but not presenting any noticeable potentiation. Data corresponding to the control group are also indicated (C, black triangles; D, filled circles). Note that these HFS animals presented acquisition curves (F(18, 162) = 175.6; *p = 0.23) and fEPSP slopes (F(18, 162) = 68; *p = 0.41) nonsignificantly different from controls. Values are expressed as mean ± SD.
Figure 8.
Figure 8.
NBQX (an AMPA antagonist) reduces the fEPSP slope evoked at the CA1 area by a single pulse applied to the ipsilateral Schaffer collateral, whereas CGP 39551 (an NMDA antagonist) blocks LTP and classical conditioning. A, At the top is shown an averaged fEPSP (n = 5 sweeps) evoked in the CA1 area by a single pulse presented to ipsilateral Schaffer collaterals, and recordings collected 30 min after NBQX (middle, 15 mg/kg, i.p.), and NBQX (15 mg/kg, i.p.) plus CGP 39551 (bottom, 6.5 mg/kg, i.p.). The histogram to the right illustrates that NBQX reduced the slope of the evoked fEPSP by some 40%, but that the addition of CGP 39551 had no additional effect. B, LTP evoked in controls (n = 5) and in animals injected with CGP 39551 (6.5 mg/kg; 60 min before HFS). C, fEPSPs recorded in the CA1 area after a single pulse presented to the ipsilateral Schaffer collaterals 300 ms after CS presentation in a control animal (1) and in a CGP 39551-injected animal (2) during the first and eighth conditioning sessions. D, Comparison of conditioned responses [EMG activity of the orbicularis oculi muscle (O.O.)] recorded during the eighth conditioning session in a control and in a CGP 39551-injected animal, respectively. Note that the CGP 39551-injected animal responded normally to US presentation. The conditioning paradigm is illustrated at the top. E, Learning curves and evolution of the synaptic field potential for controls and for the CGP 39551 group. The CGP 39551 group of animals was injected 30 min before each conditioning session (6.5 mg/kg, i.p.). Differences in conditioned responses between control (filled circles) and CGP 39551 (open circles) groups were statistically significant from the 2nd to the 10th conditioning sessions (F(13, 117) = 235.6; *p < 0.001). Evolution of the fEPSP slope is also indicated for control (black triangles) and CGP 39551 (open triangles) groups, expressed as the percentage change to mean values collected during the four habituation sessions. Differences between control and CGP 39551 groups were statistically significant from the 6th to the 10th conditioning sessions (F(13, 117) = 45.9; *p < 0.01). Values are expressed as mean ± SD.

References

    1. Barnes CA, Jung MW, McNaughton BL, Korol DL, Andreasson K, Worley PF (1994). LTP saturation and spatial learning disruption: effects of task variables and saturation levels. J Neurosci 14:5793–5806. - PMC - PubMed
    1. Berger TW, Rinaldi P, Weisz DJ, Thompson RF (1983). Single-unit analysis of different hippocampal cell types during classical conditioning of rabbit nictitating membrane response. J Neurophysiol 50:1197–1219. - PubMed
    1. Bliss TVP, Collingridge GL (1993). A synaptic model of memory: long-term potentiation in the hippocampus. Nature 361:31–39. - PubMed
    1. Bliss TVP, Gardner-Medwin AR (1973). Long-lasting potentiation of synaptic transmission in the dentate area of the unanaesthetized rabbit following stimulation of the perforant path. J Physiol (Lond) 232:357–374. - PMC - PubMed
    1. Bliss TVP, Lømo T (1973). Long-lasting potentiation of synaptic transmission in the dentate area of the anaesthetized rabbit following stimulation of the perforant path. J Physiol (Lond) 232:331–356. - PMC - PubMed

Publication types

MeSH terms

Substances

LinkOut - more resources