. 2006 Jan 25;26(4):1247-59.
doi: 10.1523/JNEUROSCI.3100-05.2006.

Temporal dynamics and latency patterns of receptor neuron input to the olfactory bulb

Affiliations

Temporal dynamics and latency patterns of receptor neuron input to the olfactory bulb

Hartwig Spors et al. J Neurosci. .

Abstract

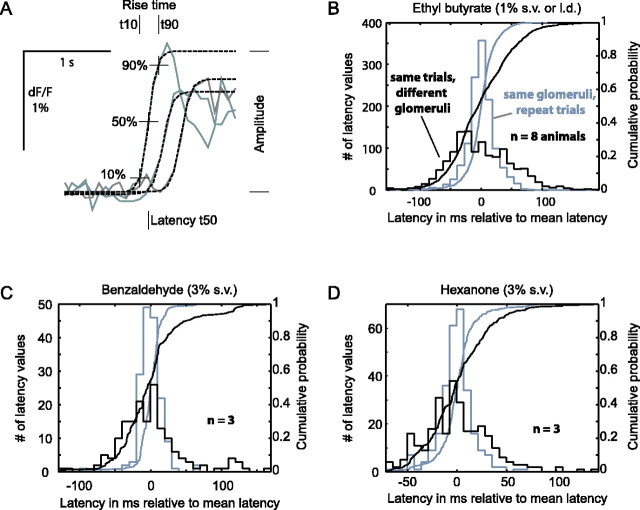
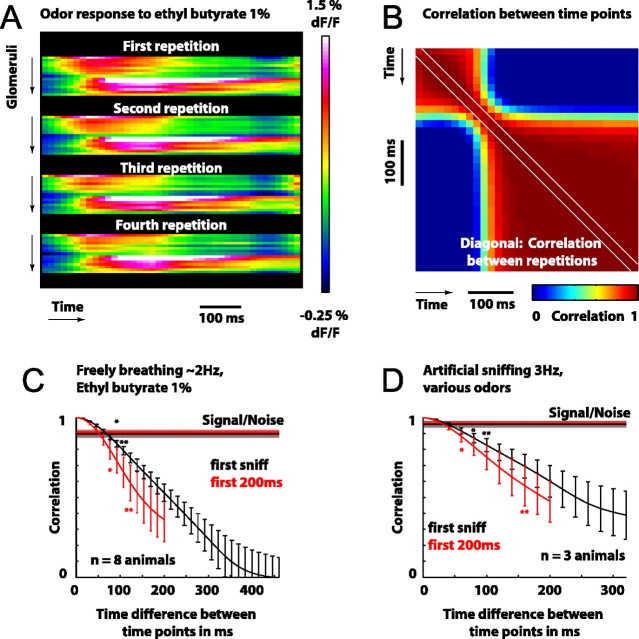
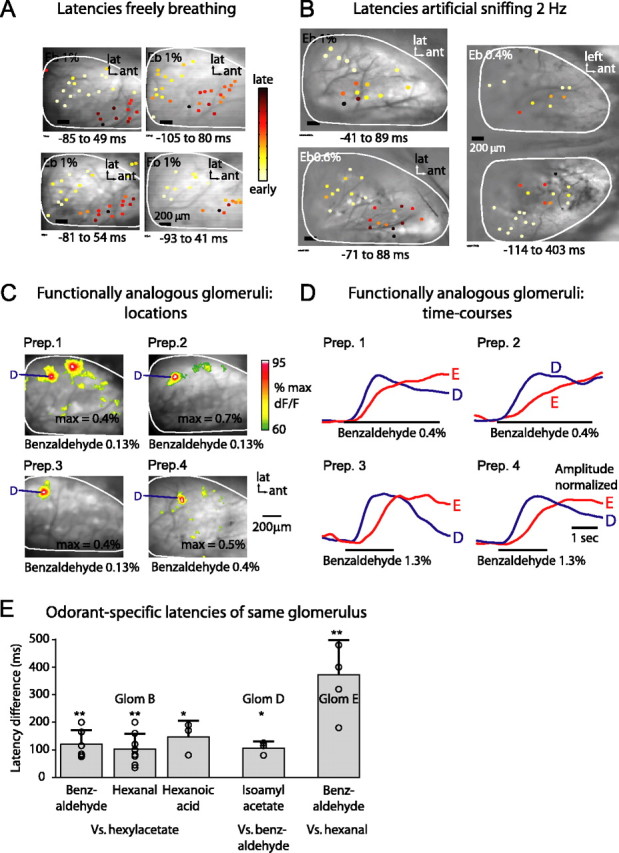
Odorants are first represented in the brain by distributed patterns of activity in the olfactory bulb (OB). Although neurons downstream of sensory inputs respond to odorants with temporally structured activity, sensory inputs to glomeruli are typically described as static maps. Here, we imaged the temporal dynamics of receptor neuron input to the OB with a calcium-sensitive dye in the olfactory receptor nerve terminals in anesthetized mice. We found that diverse, glomerulus- and odorant-dependent temporal dynamics are present even at this initial input stage. Instantaneous spatial patterns of receptor input to glomeruli changed both within and between respiration cycles. Glomerular odorant responses differed in amplitude, latency, rise time, and degree of modulation by sniffing in an odorant-specific manner. Pattern dynamics within the first respiration cycle recurred in a similar manner during consecutive cycles. When sniff rate was increased artificially, pattern dynamics were preserved in the first sniff but were attenuated during subsequent sniffs. Temporal response properties were consistent across individuals on a coarse regional scale and on a fine scale of individual glomeruli. Latency and magnitude of glomerular inputs were only weakly correlated and might therefore convey independent odorant information. These data demonstrate that glomerular maps of primary sensory input to the OB are temporally dynamic. These dynamics may contribute to the representation of odorant information and affect information processing in the central olfactory system of rodents.


Figures

Figure 1.
Figure 1.
Spatiotemporal patterning of sensory input to the olfactory bulb. A, Left, Fluorescence image of the dorsal OB after loading of ORN axons with Calcium Green-1 dextran. The outline of the dorsal OB is shown in gray. Right, Relative change in fluorescence in the same view evoked by ethyl butyrate (1% s.v.), averaged over the first respiration cycle. lat, Lateral; ant, anterior. B, Response time course of three glomeruli (see arrows with corresponding colors in A and C). The black bar indicates the odorant valve opening. Peaks in respiration trace do not correspond to the beginning of inspiration (see Materials and Methods). C, Patterns of fluorescence signals in successive 154 ms time windows (averages of 2 frames) centered on the time points indicated by the lines. The arrows point to the glomeruli depicted in B.
Figure 2.
Figure 2.
Temporal response diversity in individual glomeruli. A, Response latency, rise time, and amplitude can vary independently. Top, Response map evoked by ethyl butyrate (1% l.d.), averaged over the first respiration cycle. Bottom, Time course of the calcium signals in four glomeruli (locations shown in map) during the first respiration cycle. Average of four repetitions triggered on respiration. B, Odorant sensitivity and response latency can vary independently. Left, Maps averaged over 1 s in response to 0.2 and 0.6% s.v. ethyl butyrate. Glomerulus 1 does not respond at the lower concentration. Right, Time courses of four selected glomeruli at both concentrations. The less sensitive glomerulus 1 responds with shorter latency at the higher concentration. Maps and traces are averaged over four odorant presentations. Traces were low-pass filtered at 5 Hz with a Gaussian kernel. Maps were smoothed slightly by increasing the pixel resolution by a factor of 2 and interpolating between pixels. Mice were artificially sniffing. The gray traces show suction applied to the upper tracheotomy tube. The upward deflection corresponds to inspiration. C1, Time- averaged maps of responses to four different concentrations of benzaldehyde. Response amplitudes increase and additional glomeruli are recruited with increasing concentration. C2, Time course of the calcium signal from two glomeruli in response to the four different odorant concentrations. Each trace is averaged over four repetitions. Because of differences in breathing rate from trial to trial, the peaks occur at different times. The differences in respiration timing for the four trials shown are illustrated in C4. C3, An example of a respiration trace and time points of peaks (dots) in the respiration trace. C4, Time points of respiration trace peaks from all traces averaged and displayed in C2 (same colors). The traces were aligned to minimize time shift at the beginning of the odorant response. D1, Color-coded time course of calcium signals evoked by 2-hexanone at six different concentrations in eight glomeruli (different preparation than in C). Each column is a different time window (26 ms), and each row corresponds to an individual glomerulus. The response is normalized to the maximum for each glomerulus. D2, Latency profile from the same concentrations as in D1, measured as the time to half-maximum (T50, blue) or time to 10% of the maximum (T10, red). lat, Lateral; ant, anterior.
Figure 3.
Figure 3.
Variation of response latency. A, Examples of sigmoid fits overlaid onto the onset of the fluorescence signal for three glomeruli responding to ethyl butyrate (1% l.d.). The quantified parameters are indicated in the plot. B–D, Distributions of relative response latencies for three different odorants, measured in multiple glomeruli from multiple animals (see Results). The y-axis of the histograms (left side) indicates the number of occurrences in each 10 ms time bin. Gray histograms, Latency values of each glomerulus were centered on zero by subtracting the glomerulus-specific mean latency (see Results). The distribution reflects trial-to-trial variability of response latency. Black histogram, Distributions of relative response latencies were not centered. This distribution reflects glomerulus-specific differences in response latency. Curves, Cumulative probability distributions of histograms with the same color. B, SD of trial-to-trial variability, 23 ms; SD of glomerulus-specific variability, 51 ms; p < 0.001, Kolmogorov–Smirnov test; data from 174 glomeruli (n = 8 mice). C, SD of trial-to-trial variability, 16.8 ms; SD of glomerulus-specific variability, 45.5 ms; p < 0.001, Kolmogorov–Smirnov test; data from 59 glomeruli (n = 3 mice). D, SD of trial-to-trial variability, 19.9 ms; SD of glomerulus-specific variability, 39.4 ms; p < 0.001, Kolmogorov–Smirnov test; data from 93 glomeruli (n = 3 mice).
Figure 4.
Figure 4.
Change of glomerular response maps during a respiration cycle. A, Responses of 15 glomeruli to four presentations of ethyl butyrate (1% l.d.). Each row corresponds to one glomerulus. The x-axis represents time. B, Correlation of response pattern between different time points. The x- and y-axes both represent time. Each pixel corresponds to the correlation value between patterns at the time points of the x- and y-axes. Displayed is the average correlation generated from eight repetitions of the odorant ethyl butyrate (1% l.d.) in the same animal (see Materials and Methods). The correlation coefficient is color coded. The diagonal shows the correlation between repetitions (measure of signal-to-noise ratio) instead of the autocorrelation. C, Correlation between time points as a function of the time difference (Δt) between them. The black curve represents the first sniff cycle. The red curve represents the first 200 ms. The horizontal bars indicate the correlation between repetitions (measure of signal-to-noise ratio). The error bars are SEM calculated over eight animals after averaging the values from data with eight repetitions of the odorant presentation. Significance levels: *p < 0.05; **p < 0.01. D, Same analysis for responses in mice artificially sniffing at 3 Hz. Odorants were ethyl butyrate (3 animals); methyl benzoate (2 animals); hexanal and heptanone (1 animal each). Odorant presentations were repeated three or four times.
Figure 5.
Figure 5.
Odorant-specific patterns of response latency across glomeruli. A, Response time courses of five glomeruli to each of three odorants (5% s.v.), normalized to the maximum for each response. Average of four repetitions. For location of the glomeruli, see B. Odor stimulation and respiration pulse are shown as in Figure 2C. B, Spatial activity patterns evoked by the three different odorants, averaged in time over the first respiration cycle, normalized to their maximum. Average of four odorant presentations. med, Medial; ant, anterior. C, Enlargement of the time courses in A during response onset. The trace colors are as in A. D, Response latencies of each glomerulus to four repetitions of each stimulus. Each dot depicts the relative response latency of one glomerulus in one trial, measured as the time to half-maximum of a sigmoid fit to the response onset (Fig. 3A). The horizontal error bars depict mean and SEM of latencies for each glomerulus and odorant. The colors of plot symbols correspond to trace colors in A. E1, E2, Two additional examples for odorant-specific latencies from two different animals using the same conventions as in D. MB, Methyl benzoate; BA, butyl acetate; BZ, benzaldehyde; HX, 2-hexanone. The colors in the same panel represent the same glomerulus. The colors in different panels do not depict corresponding glomeruli.
Figure 6.
Figure 6.
Recurrence of glomerular input pattern dynamics in subsequent breathing cycles. A, Responses across several breathing cycles during stimulation with ethyl butyrate (1% l.d.). Response displayed in movie frames (77 ms) were aligned to respiration and spatially low-pass filtered with a Gaussian kernel (σ = 13.3 μm). B, Response time courses of two selected glomeruli. C1, Spatial pattern of response latencies for individual glomeruli, measured as time to half-maximum of a sigmoid fit to the response onset (Fig. 3A). Regions were selected by an automated procedure detecting glomerular activity structures (see Materials and Methods). C2, Spatial pattern of time shifts of the calcium signal, relative to the mean signal, determined from the response time course over all four breathing cycles. Correlation between C1 and C2, r = 0.97. D, Spatial pattern of time shifts of the calcium signal, relative to the mean signal, during subsequent breathing cycles. The color scale and clipping range are as in C2. Average correlation between cycles, r = 0.94. E, Effect of increasing respiration frequency in an artificially sniffing mouse. E1, Maps at the time points indicated in the top trace of (E2) were integrated over 40 ms, spatially filtered with a Gaussian kernel (σ = 6.5 μm), and normalized to their maximum. E2, Responses of three glomeruli to the same odorant; suction to the tracheotomy tube was applied at different frequencies. The black trace represents negative pressure in the suction line attached to the upper tracheotomy tube. All traces are scaled to their maximum. n indicates number of repetitions averaged for each trace. lat, Lateral; ant, anterior.
Figure 7.
Figure 7.
Consistency of spatiotemporal glomerular response properties across individuals. A, Spatial distribution of relative response latencies (t50) after stimulation with ethyl butyrate in four different freely breathing mice (compare Fig. 6C). B, Spatial distribution of relative response latencies after stimulation with ethyl butyrate in three different mice under artificial sniff conditions. C, Location of glomerulus D, identified by its response to a low concentration of benzaldehyde, in four different animals. D, Responses of identified glomeruli D and E to benzaldehyde in four different animals. Animals were tracheotomized and odorants were delivered to the nasal epithelium by artificial sniffing (see Materials and Methods). Traces were temporally low-pass filtered (1 Hz cutoff, low-pass Gaussian filter kernel with low sharpness) to emphasize slow temporal differences and normalized to their maximum. E, Response latencies of three identified glomeruli (B, D, E) in different animals, relative to the latency of response to a reference odorant for each glomerulus. The latency in response to the reference odorant was subtracted for each animal. Error bars represent SD. Significant differences between latencies in response to reference and test odorants were determined by a one-tailed Student’s t test. Significance levels: *p < 0.05; **p < 0.01. The reference odorants are benzaldehyde for glomeruli D and E, and hexyl acetate for glomerulus B. Eb, Ethyl butyrate; Glom, glomerulus; Prep., preparation; lat, lateral; ant, anterior.

Similar articles

Cited by

References

    1. Abraham NM, Spors H, Carleton A, Margrie TW, Kuner T, Schaefer AT (2004). Maintaining accuracy at the expense of speed; stimulus similarity defines odor discrimination time in mice. Neuron 44:865–876. - PubMed
    1. Adrian ED (1950). The electrical activity of the mammalian olfactory bulb. Electroencephalogr Clin Neurophysiol 2:377–388. - PubMed
    1. Ambros-Ingerson J, Granger R, Lynch G (1990). Simulation of paleocortex performs hierarchical clustering. Science 247:1344–1348. - PubMed
    1. Aroniadou-Anderjaska V, Zhou FM, Priest CA, Ennis M, Shipley MT (2000). Tonic and synaptically evoked presynaptic inhibition of sensory input to the rat olfactory bulb via GABAB heteroreceptors. J Neurophysiol 84:1194–1203. - PubMed
    1. Belluscio L, Katz LC (2001). Symmetry, stereotypy, and topography of odorant representations in mouse olfactory bulbs. J Neurosci 21:2113–2122. - PMC - PubMed

Publication types

LinkOut - more resources