. 2006 Jan 25;26(4):1293-302.
doi: 10.1523/JNEUROSCI.4511-05.2006.

Rapid brain discrimination of sounds of objects

Affiliations

Rapid brain discrimination of sounds of objects

Micah M Murray et al. J Neurosci. .

Abstract

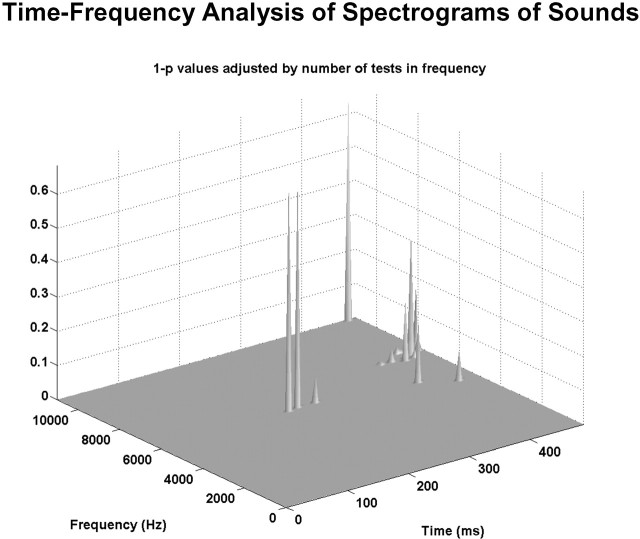
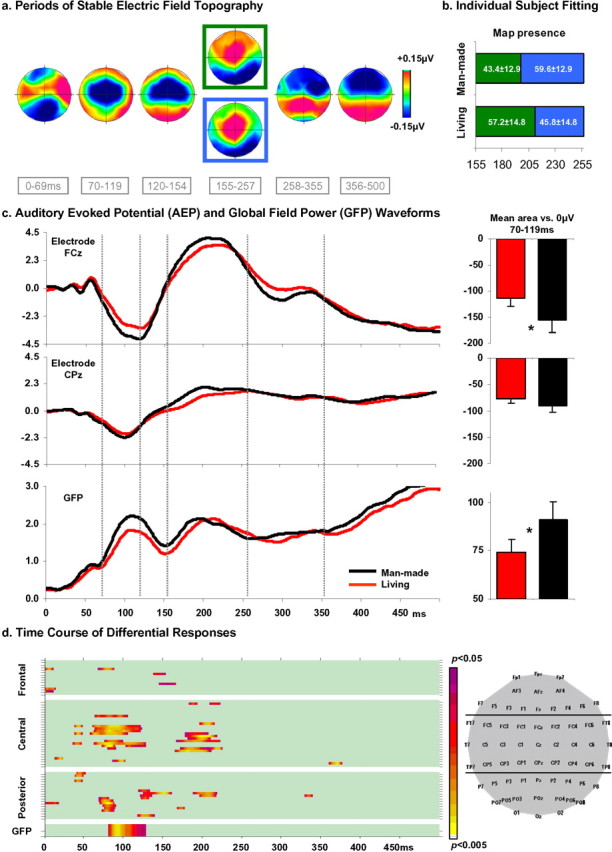
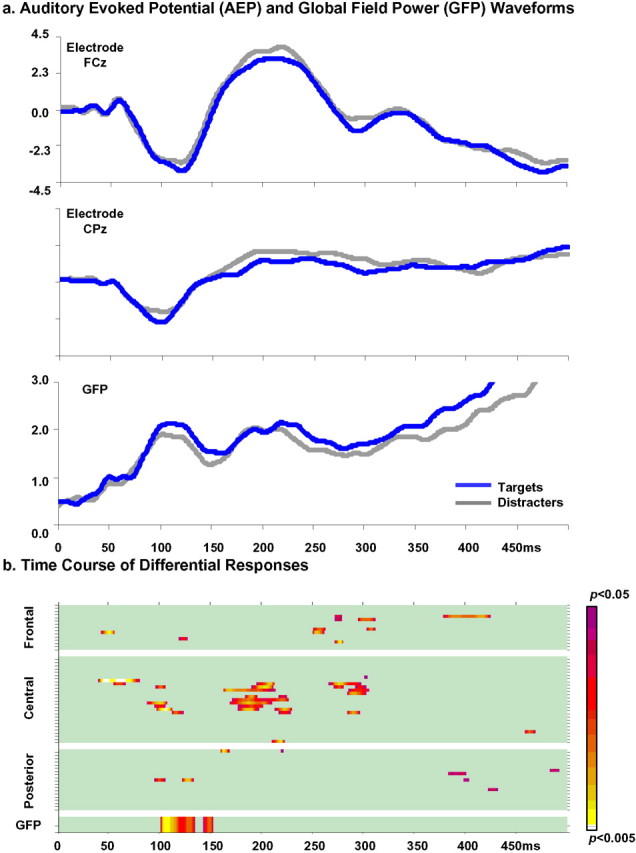
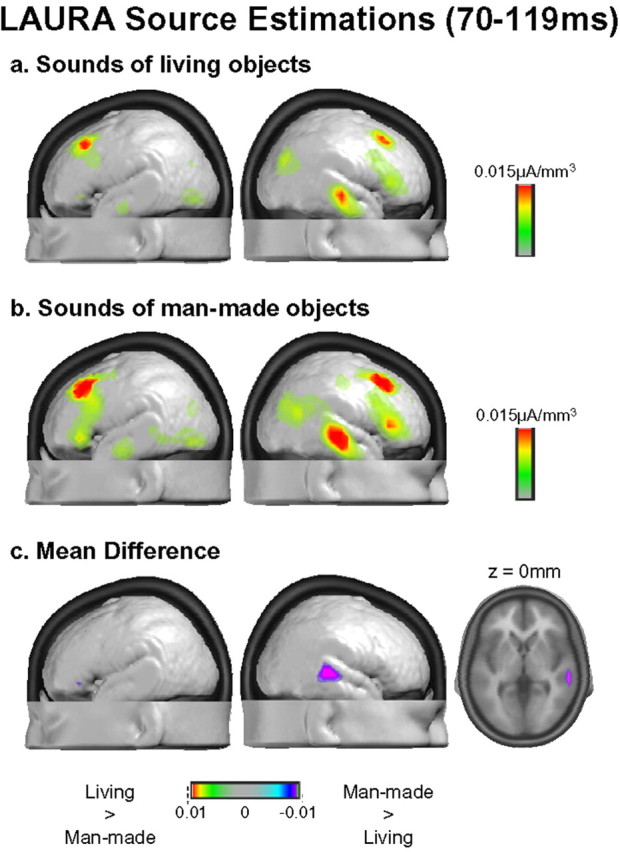
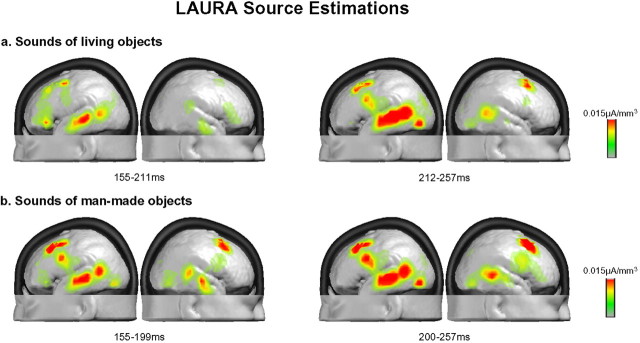
Electrical neuroimaging in humans identified the speed and spatiotemporal brain mechanism whereby sounds of living and man-made objects are discriminated. Subjects performed an "oddball" target detection task, selectively responding to sounds of either living or man-made objects on alternating blocks, which were controlled for in their spectrogram and harmonics-to-noise ratios between categories. Analyses were conducted on 64-channel auditory evoked potentials (AEPs) from nontarget trials. Comparing responses to sounds of living versus man-made objects, these analyses tested for modulations in local AEP waveforms, global response strength, and the topography of the electric field at the scalp. In addition, the local autoregressive average distributed linear inverse solution was applied to periods of observed modulations. Just 70 ms after stimulus onset, a common network of brain regions within the auditory "what" processing stream responded more strongly to sounds of man-made versus living objects, with differential activity within the right temporal and left inferior frontal cortices. Over the 155-257 ms period, the duration of activity of a brain network, including bilateral temporal and premotor cortices, differed between categories of sounds. Responses to sounds of living objects peaked approximately 12 ms later and the activity of the brain network active over this period was prolonged relative to that in response to sounds of man-made objects. The earliest task-related effects were observed at approximately 100 ms poststimulus onset, placing an upper limit on the speed of cortical auditory object discrimination. These results provide critical temporal constraints on human auditory object recognition and semantic discrimination processes.


Figures

Figure 1.
Figure 1.
Analysis of stimulus spectograms. Time-frequency distribution of the results of the Kolmogorov–Smirnov test (p < 0.05; adjusted for the number of frequency bins) comparing spectograms from living and man-made sound categories. The z-axis indicates 1 minus the p value. Note that effects were only present after ∼125 ms of sound onset.
Figure 2.
Figure 2.
Electrical neuroimaging results for the contrast of living versus man-made sounds. a, The topographic pattern analyses identified seven stable topographies for both conditions over the 500 ms poststimulus period. The time period when each map was observed is indicated. Over the initial 155 ms poststimulus period, the same series of maps was observed in response to both sounds of living and man-made objects. At the group-average level, different maps were observed for each condition over the 155–257 ms period (framed in green and blue). b, The results of the individual subject fitting procedure revealed that these maps differentially accounted for the responses to sounds of living and man-made objects. c, The time periods when stable topographies were observed served as the basis for the time windows from which area measures were calculated at specific scalp sites and from the global field power. Bar graphs display the mean (±SEM) area from these midline electrodes and the global field power over the 70–119 ms period (*p < 0.01). d, A more precise determination of the time course of differential processing was obtained with a point-wise t test for each electrode and for the GFP. See Results for details.
Figure 3.
Figure 3.
Electrophysiological results for the contrast of target and distracter trials elicited by the same sounds. a, AEP and GFP waveforms show differential responses beginning at ∼100 ms poststimulus onset. b, The timing of such effects was statistically tested with point-wise t tests at each electrode and for the GFP. See Results for details.
Figure 4.
Figure 4.
LAURA source estimations over the 70–119 ms period. a and b show group-averaged (n = 9) source estimations for each stimulus condition. c depicts the mean (n = 9) difference of these source estimations.
Figure 5.
Figure 5.
LAURA source estimations over the 155–257 ms period. a, Group-averaged (n = 9) source estimations for sounds of living objects over time periods in which different scalp topographies were identified. b, Group-averaged (n = 9) source estimations for sounds of man-made objects over time periods in which different scalp topographies were identified.

Similar articles

Cited by

References

    1. Alain C, Arnott SR, Hevenor S, Graham S, Grady CL (2001). “What” and “where” in the human auditory system. Proc Natl Acad Sci USA 98:12301–12306. - PMC - PubMed
    1. Arnott SR, Binns MA, Grady CL, Alain C (2004). Assessing the auditory dual-pathway model in humans. NeuroImage 22:401–408. - PubMed
    1. Belin P, Zatorre RJ, Lafaille P, Ahad P, Pike B (2000). Voice-selective areas in human auditory cortex. Nature 403:309–312. - PubMed
    1. Belin P, Fecteau S, Bedard C (2004). Thinking the voice: neural correlates of voice perception. Trends Cogn Sci 8:129–135. - PubMed
    1. Bergerbest D, Ghahremani DG, Gabrieli JDE (2004). Neural correlates of auditory repetition priming: reduced fMRI activation in the auditory cortex. J Cogn Neurosci 16:966–977. - PubMed

Publication types