

Prognostic gene expression signatures can be measured in tissues collected in RNAlater preservative
- PMID: 16436632
- PMCID: PMC1867564
- DOI: 10.2353/jmoldx.2006.050056
Prognostic gene expression signatures can be measured in tissues collected in RNAlater preservative
Abstract
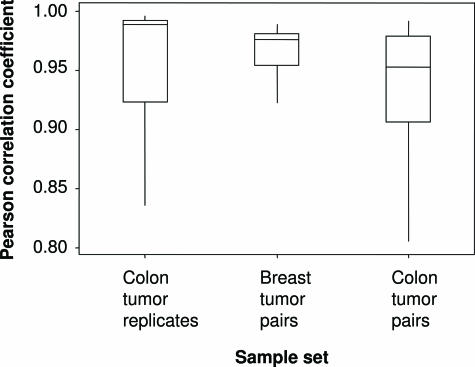
Gene expression signatures have the ability to serve in both prognostic and predictive capacities in patient management. The use of RNA as the starting material and the lability of this analyte, however, dictate that tissues must be snap-frozen or stored in a solution that can maintain the integrity of the RNA. We compared pairs of snap-frozen and RNAlater preservative-suspended tissue from 30 such paired lymph node-negative breast tumors and 21 such paired Dukes' B colon tumors. We assessed the correlation of gene expression profiles and prediction of recurrence based on two prognostic algorithms. Tissues stored in RNAlater preservative generated expression profiles with excellent correlation (average Pearson correlation coefficients of 0.97 and 0.94 for the breast and colon tumor pairs, respectively) compared to those produced by tissues that were snap-frozen. The correlation in the prediction of recurrence was 97% and 95% for the breast and colon tumor pairs, respectively, between these two types of tissue handling protocols. This novel finding demonstrates that prognostic signatures can be obtained from RNAlater preservative-suspended tissues, an important step in bringing gene expression signatures to the clinic.
Figures
References
-
- Butte A. The use and analysis of microarray data. Nat Rev Drug Discov. 2002;1:951–960. - PubMed
-
- Meltzer PS. Spotting the target: microarrays for disease gene discovery. Curr Opin Genet Dev. 2001;11:258–263. - PubMed
-
- Huang E, Ishida S, Pittman J, Dressman H, Bild A, Kloos M, D’Amico M, Pestell RG, West M, Nevins JR. Gene expression phenotypic models that predict the activity of oncogenic pathways. Nat Genet. 2003;34:226–230. - PubMed
-
- Ramaswamy S, Ross KN, Lander ES, Golub TR. A molecular signature of metastasis in primary solid tumors. Nat Genet. 2003;33:49–54. - PubMed
-
- van de Vijver MJ, He YD, van’t Veer LJ, Dai H, Hart AA, Voskuil DW, Schreiber GJ, Peterse JL, Roberts C, Marton MJ, Parrish M, Atsma D, Witteveen A, Glas A, Delahaye L, van der Velde T, Bartelink H, Rodenhuis S, Rutgers ET, Friend SH, Bernards R. A gene-expression signature as a predictor of survival in breast cancer. N Engl J Med. 2002;347:1999–2009. - PubMed
Publication types
MeSH terms
Substances
LinkOut - more resources
Full Text Sources
Other Literature Sources
Medical
Molecular Biology Databases
Miscellaneous
