. 2006 Feb;50(2):428-38.
doi: 10.1128/AAC.50.2.428-438.2006.

Novel mechanism of antibiotic resistance originating in vancomycin-intermediate Staphylococcus aureus

Affiliations

Novel mechanism of antibiotic resistance originating in vancomycin-intermediate Staphylococcus aureus

Longzhu Cui et al. Antimicrob Agents Chemother. 2006 Feb.

Abstract

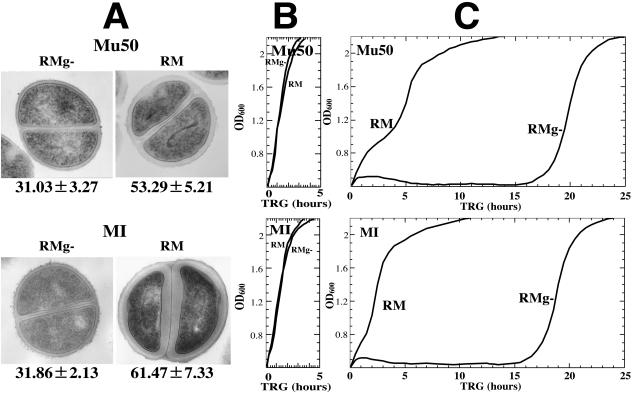
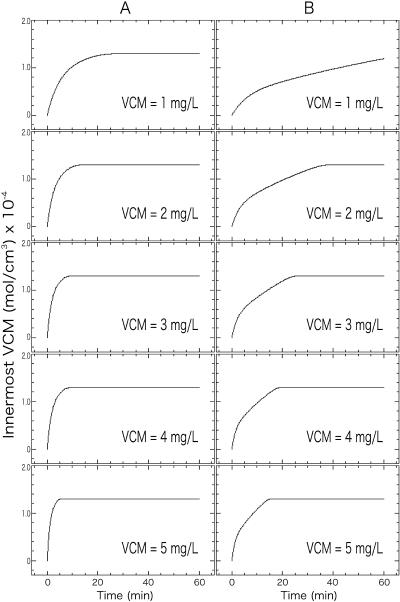
As an aggressive pathogen, Staphylococcus aureus poses a significant public health threat and is becoming increasingly resistant to currently available antibiotics, including vancomycin, the drug of last resort for gram-positive bacterial infections. S. aureus with intermediate levels of resistance to vancomycin (vancomycin-intermediate S. aureus [VISA]) was first identified in 1996. The resistance mechanism of VISA, however, has not yet been clarified. We have previously shown that cell wall thickening is a common feature of VISA, and we have proposed that a thickened cell wall is a phenotypic determinant for vancomycin resistance in VISA (L. Cui, X. Ma, K. Sato, et al., J. Clin. Microbiol. 41:5-14, 2003). Here we show the occurrence of an anomalous diffusion of vancomycin through the VISA cell wall, which is caused by clogging of the cell wall with vancomycin itself. A series of experiments demonstrates that the thickened cell wall of VISA could protect ongoing peptidoglycan biosynthesis in the cytoplasmic membrane from vancomycin inhibition, allowing the cells to continue producing nascent cell wall peptidoglycan and thus making the cells resistant to vancomycin. We conclude that the cooperative effect of the clogging and cell wall thickening enables VISA to prevent vancomycin from reaching its true target in the cytoplasmic membrane, exhibiting a new class of antibiotic resistance in gram-positive pathogens.


Figures

FIG. 1.
FIG. 1.
Thickened cell wall and level of vancomycin resistance. (A) Transmission electron microscopy images of representative cells with thin and thick cell walls prepared as described previously (12). The cell wall thickness, in nanometers (mean ± SD), is given under each image. (B and C) Growth curves in BHI medium without vancomycin (B) and with vancomycin at 30 mg/liter (C). Growth curves were recorded by measuring the OD600 with a photorecording incubator (TN-261; ADVANTEC, Tokyo, Japan) at 37°C. Vancomycin susceptibility was determined by measuring the time required for regrowth in BHI medium (12). No difference was seen between growth rates of cells with thin versus thick cell walls in the absence of vancomycin (B). In the presence of vancomycin, cells with thin cell walls showed delayed growth compared to cells with thick cell walls (C).
FIG. 2.
FIG. 2.
Comparison of vancomycin consumption and growth capability between cells with thin and thick cell walls. (A) Vancomycin consumption was compared by plotting vancomycin concentrations remaining in the medium as functions of incubation time. During the time the cells were incubated in RMg- containing 30 mg/liter vancomycin, 0.5 ml of cell preparations with thin and thick cell walls was taken out at selected time intervals to measure vancomycin consumption. Concentrations of vancomycin remaining in the medium and numbers of viable cells were determined up to 120 min as described in Materials and Methods. Arrows indicate the TCMV. The y axis indicates the vancomycin (VCM) concentration remaining in the medium. Symbols: circles, vancomycin concentrations; squares, cell numbers. Open symbols, cells with thin cell walls; solid symbols, cells with thick cell walls. Error bars fall within the symbol size and are therefore not shown except for open circles. (B and C) Growth capabilities of cells with thin (B) and thick (C) cell walls after exposure to vancomycin for various times. Portions (0.1 ml) of the cell preparations taken out for the experiment for which results are shown in panel A were inoculated in 10 ml prewarmed growth-supportive BHI medium, and growth curves were recorded as described for Fig. 1. Data in all panels are results of three independent experiments.
FIG.3.
FIG.3.
Intactness of 3-dimensional structure of cell wall and vancomycin consumption. Consumption of vancomycin (VCM) by cells with thin (circles) and thick (triangles) cell walls was compared after the cell walls were digested by various concentrations of lysostaphin (A to E) or mechanically disrupted by sonication (F). Vancomycin concentrations remaining in the medium were determined at selected time intervals during the incubation. Arrows indicate the TCMV.
FIG. 4.
FIG. 4.
Models of vancomycin consumption by cells with thin and thick cell walls. Model calculations (Calc) and comparisons with experimental data (Exp) are given. Two models were examined. (A) Vancomycin consumption curves for cells with thin and thick cell walls calculated using a standard reaction-diffusion equation with diffusion constant D and compared with experimental data. (B) Vancomycin consumption curves for cells with thin and thick cell walls calculated using a clogging model according to equation 3 and compared with experimental data. The diffusion constant D0 and clogging parameter β were determined as the best-fit values for these data. Error bars for experimental data points fall within the symbol size.
FIG. 5.
FIG. 5.
Comparison of mathematical calculations and experimental data for membrane-bound vancomycin. (A) Amount of bound vancomycin located at the innermost segment (cytoplasmic membrane) of cells with thick cell walls, calculated with both a standard reaction-diffusion equation (broken line) and a clogging model (solid line). (B) The amount of membrane-bound vancomycin was determined for both cells with thin cell walls and cells with thick cell walls. Cell preparations with thin (open circles) and thick (closed circles) cell walls were exposed to vancomycin for 2.5, 5, 15, 30, and 60 min and were used to determine membrane-bound vancomycin concentrations by microbiological assay and HPLC assay. Membrane-bound vancomycin levels increased in accordance with vancomycin exposure time, and the curve of the increment shows an upward-convex shape, which coincides with theoretical curves developed by introducing the clogging factor (solid line in panel A).
FIG. 6.
FIG. 6.
Rate of incorporation of d-[14C]glucose into cell wall peptidoglycan. Incorporation rates were compared for cells with thin and thick cell walls after they were exposed to vancomycin. Cultures of cells with thin (A) and thick (B) cell walls, prepared similarly to those used for the experiments for which results are shown in Fig. 1, were exposed to 30 mg/liter vancomycin for 0, 2, 4, 15, and 30 min in RMg- medium. Determination of d-[14C]glucose incorporation into cell wall peptidoglycan was carried out after purification of cell wall peptidoglycan. Counts per minute were measured at the time points indicated. Results represent three independent experiments.
FIG. 7.
FIG. 7.
Simulation for the saturation curve of bound vancomycin (VCM) in the innermost cell wall segments (cell membranes) of VISA strain Mu50 and vancomycin-susceptible strain N315. The time dependence of vancomycin saturation in the innermost cell wall layer was predicted with clogging model parameters (D0 = 2.60 × 10⁻⁹ cm2/s; β = 0.97 [see Fig. 4B]) for vancomycin-susceptible strain N315 (A) and VISA strain Mu50 (B). Cell wall thicknesses used for this calculations were 21.46 ± 2.25 nm for N315 and 35.02 ± 4.01 nm for Mu50 (11), and the vancomycin concentration in the medium was set as a constant.

References

    1. Barna, J., and D. Williams. 1984. The structure and mode of action of glycopeptide antibiotics of the vancomycin group. Annu. Rev. Microbiol. 38:339-357. - PubMed
    1. Bischoff, M., M. Roos, J. Putnik, A. Wada, P. Glanzmann, P. Giachino, P. Vaudaux, and B. Berger-Bachi. 2001. Involvement of multiple genetic loci in Staphylococcus aureus teicoplanin resistance. FEMS Microbiol. Lett. 194:77-82. - PubMed
    1. Boyle-Vavra, S., B. L. de Jonge, C. C. Ebert, and R. S. Daum. 1997. Cloning of the Staphylococcus aureus ddh gene encoding NAD+-dependent d-lactate dehydrogenase and insertional inactivation in a glycopeptide-resistant isolate. J. Bacteriol. 179:6756-6763. - PMC - PubMed
    1. Boyle-Vavra, S., H. Labischinski, C. C. Ebert, K. Ehlert, and R. S. Daum. 2001. A spectrum of changes occurs in peptidoglycan composition of glycopeptide-intermediate clinical Staphylococcus aureus isolates. Antimicrob. Agents Chemother. 45:280-287. - PMC - PubMed
    1. Centers for Disease Control and Prevention. 2002. Staphylococcus aureus resistant to vancomycin—United States. Morb. Mortal. Wkly. Rep. 51:565-567. - PubMed

Publication types