Comparative Study
. 2006 Feb;238(2):425-37.
doi: 10.1148/radiol.2381041336.

Breast lesions: evaluation with US strain imaging--clinical experience of multiple observers

Affiliations
Comparative Study

Breast lesions: evaluation with US strain imaging--clinical experience of multiple observers

Dawn M Regner et al. Radiology. 2006 Feb.

Abstract

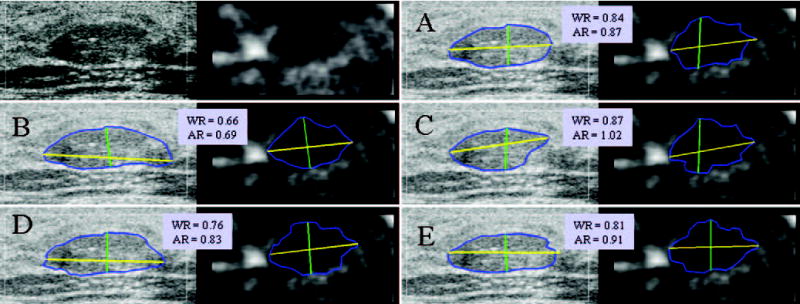
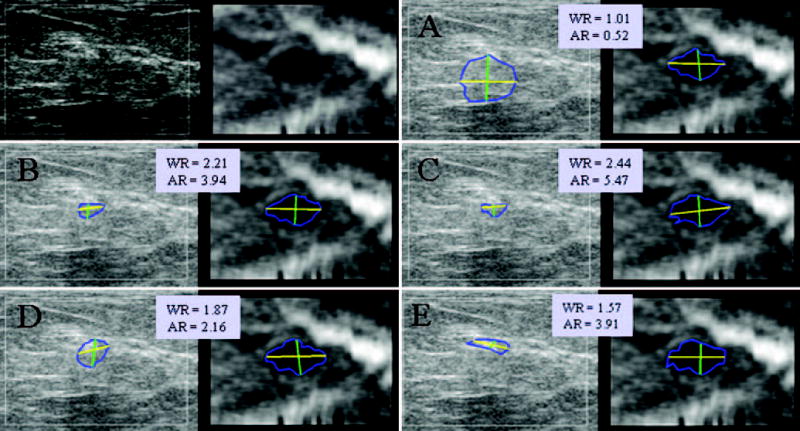
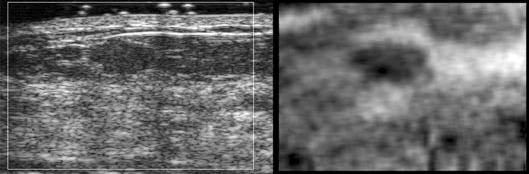
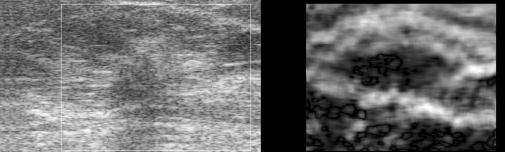
Purpose: To prospectively determine the accuracy of using an ultrasonographic (US) strain imaging technique known as lesion size comparison to differentiate benign from malignant breast lesions.

Materials and methods: Institutional Review Board approval and patient informed consent were obtained for this HIPPA-compliant study. US strain imaging was performed prospectively for 89 breast lesions in 88 patients. Lesions were imaged by using freehand compression and a real-time strain imaging algorithm. Five observers obtained manual measurements of lesion height, width, and area from B-mode and strain images. By using these size measurements, individual observer and group performances were assessed by using the area under the receiver operating characteristic curve (A(z)). The performance of a single size parameter versus that of a combination of size parameters was evaluated by using univariate and multivariate logistic regression.

Results: Group A(z) values showed that width ratio and area ratio yielded the best results for differentiating benign and malignant breast lesions, and they were not statistically different from one another (P = .499). For the group, the performance of area and width, which was superior to that of height and aspect ratio, was statistically significant for all cases (P < .011) except for those that compared area with aspect ratio (P = .118). By using a group threshold of 1.04 for width ratio and 1.13 for area ratio, the sensitivity and specificity of the technique were 96% and 21%, respectively, for width and 96% and 24%, respectively, for area. The best observer achieved a sensitivity of 96% and a specificity of 61% by using the area ratio. For all but one observer, combined size parameters did not improve observer performance (P > .258). Significant interobserver performance variability was observed (P < .001).

Conclusion: Results suggest that US strain imaging has the potential to aid diagnosis of breast lesions. However, manually tracing lesion boundaries for size ratio differentiation in a busy clinical setting did not match the diagnostic performance levels previously reported. Focusing on measurements of lesion width, along with additional observer training or automated processes, may yield a suitable method for routine clinical application.


Figures

Figure 1
Figure 1
Side-by-side paired displays of B-mode (left image of each pair) and strain (right image of each pair) US images of benign fibroadenoma. Unmarked reference images (upper left pair) along with images showing measurements of height (green line), width (yellow line), and traced area (blue line) are displayed for each observer (A–E). The resulting size ratios for width (WR) and area (AR) are noted. By using the group area and width threshold ratios presented in Table 4, strain imaging was used to correctly predict lesion benignity (true-negative finding).
Figure 2
Figure 2
Side-by-side paired displays of B-mode (left image of each pair) and strain (right image of each pair) US images of invasive ductal carcinoma. Unmarked reference images (upper left pair) along with images showing measurements of height (green line), width (yellow line), and traced area (blue line) are displayed for each observer (A–E). The resulting size ratios for width (WR) and area (AR) are noted. Lesion has somewhat indistinct borders on B-mode images and demonstrates that marked interobserver measurement variability can result with this technique. By using the group width and area threshold ratios (Table 4), strain imaging was used to correctly predict lesion malignancy (true-positive finding).
Figure 3
Figure 3
Side-by-side paired displays of B-mode (left image of each pair) and strain (right image of each pair) US images of benign fat necrosis. Unmarked reference images (upper left pair) along with images showing measurements of height (green line), width (yellow line), and traced area (blue line) are displayed for each observer (A–E). The resulting size ratios for width (WR) and area (AR) are noted. Images illustrate one of the potential problems with this technique in that, for some lesions, the lesion is difficult, if not impossible, to distinguish from the surrounding breast tissue on B-mode images. This likely makes measurements of lesion size on B-mode images inaccurate, and as shown here, different observers will vary widely in their interpretation of border and size measurements. In this example, only the size ratios for observer A correctly predicted lesion benignity. This lesion also demonstrates how strain imaging can confirm the presence of subtle lesions, which are much more conspicuous at strain imaging.
Figure 4
Figure 4
Side-by-side paired display of B-mode (left) and strain (right) US images of fibrocystic change. By using the group width and area thresholds presented in Table 4, strain imaging was used to incorrectly predict lesion malignancy (false-positive finding).
Figure 5
Figure 5
Side-by-side paired display of B-mode (left) and strain (right) US images of invasive ductal carcinoma. Lesion appears much bigger on strain image than on corresponding B-mode image. By using the group area and width threshold ratios presented in Table 4, strain imaging was used to correctly predict lesion malignancy (true-positive finding).
Figure 6
Figure 6
Side-by-side paired display of B-mode (left) and strain (right) US images of invasive ductal carcinoma. By using the group width and area threshold ratios presented in Table 4, strain imaging was used to correctly predict lesion malignancy (true-positive finding).
Figure 7
Figure 7
Side-by-side paired display of B-mode (left) and strain (right) US images of invasive lobular carcinoma. By using the group width and area threshold ratios presented in Table 4, strain imaging was used to correctly predict lesion malignancy (true-positive finding).
Figure 8
Figure 8
Side-by-side paired display of B-mode (left) and strain (right) US images of invasive ductal carcinoma. Lesion width and area are similar on strain and B-mode images. By using the group width and area threshold ratios presented in Table 4, strain imaging was used to incorrectly predict lesion benignity (false-negative finding).
Figure 9
Figure 9
Side-by-side paired display of B-mode (left) and strain (right) US images of benign stromal fibrosis in patient with a history of breast cancer. Anecdotally, strain images that show little or no contrast between the lesion and the surrounding breast tissue, as is seen in this patient, seem to be a reliable indicator of benignity.
Figure 10
Figure 10
Graph of own image group width ratios plotted for each lesion in the study. Horizontal line represents optimal group threshold ratio of 1.04. Above this threshold, malignant lesions were classified as true-positive findings, and below this threshold, benign lesions were classified as true-negative findings. Although malignant lesions tend to have larger width ratios, one can see that there is considerable overlap near the threshold line, which is reflected in low specificity values.
Figure 11
Figure 11
Graph of own image group area ratios plotted for each lesion in the study. Horizontal line represents optimal group threshold ratio of 1.13. Above this threshold, malignant lesions were classified as true-positive findings, and below this threshold, benign lesions were classified as true-negative findings. Although malignant lesions tend to have larger area ratios, as is the case with width, one can see that there is considerable overlap near the threshold line, which is reflected in low specificity values.

References

    1. Anderson WAD. Pathology. St Louis, Mo: Mosby; 1953.
    1. Lerner RM, Huang SR, Parker KJ. Sonoelasticity images derived from ultrasound signals in mechanically vibrated tissues. Ultrasound Med Biol. 1990;16:231–239. - PubMed
    1. Ophir J, Cespedes EI, Ponnekanti H, Yazdi Y, Li X. Elastography: a quantitative method for imaging the elasticity of biological tissues. Ultrason Imaging. 1991;13:111–134. - PubMed
    1. O’Donnell M, Skovoroda A, Shapo B, Emelianov S. Internal displacement and strain imaging using ultrasonic speckle tracking. IEEE Trans Ultrason Ferroelectr Freq Control. 1994;41:314–325.
    1. Skovoroda AR, Emelianov Y, O’Donnell M. Tissue elasticity reconstruction based on ultrasonic displacement and strain images. IEEE Trans Ultrason Ferroelectr Freq Control. 1995;42:747–765.

Publication types