. 2006 Jan 26:7:44.
doi: 10.1186/1471-2105-7-44.

An improved distance measure between the expression profiles linking co-expression and co-regulation in mouse

Affiliations

An improved distance measure between the expression profiles linking co-expression and co-regulation in mouse

Ryung S Kim et al. BMC Bioinformatics. .

Abstract

Background: Many statistical algorithms combine microarray expression data and genome sequence data to identify transcription factor binding motifs in the low eukaryotic genomes. Finding cis-regulatory elements in higher eukaryote genomes, however, remains a challenge, as searching in the promoter regions of genes with similar expression patterns often fails. The difficulty is partially attributable to the poor performance of the similarity measures for comparing expression profiles. The widely accepted measures are inadequate for distinguishing genes transcribed from distinct regulatory mechanisms in the complicated genomes of higher eukaryotes.

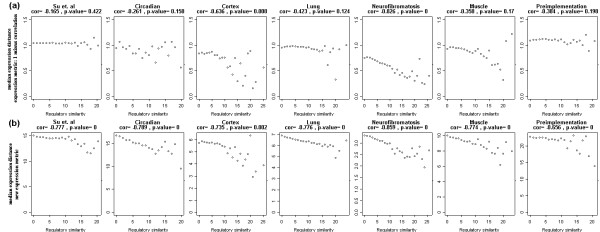
Results: By defining the regulatory similarity between a gene pair as the number of common known transcription factor binding motifs in the promoter regions, we compared the performance of several expression distance measures on seven mouse expression data sets. We propose a new distance measure that accounts for both the linear trends and fold-changes of expression across the samples.

Conclusion: The study reveals that the proposed distance measure for comparing expression profiles enables us to identify genes with large number of common regulatory elements because it reflects the inherent regulatory information better than widely accepted distance measures such as the Pearson's correlation or cosine correlation with or without log transformation.


Figures

Figure 1
Figure 1
Correlation of median expression distance with the regulatory similarity in seven data sets. Each point is the observed median expression distance of gene pairs as a function of the number of common TFBMs in the pairs. Two expression distance measures are used: (a) 1 minus correlation, and (b) the new expression distance measure. For each data set, the correlation between median expression distance and regulatory similarity is computed. To calculate the significance of such correlations, the mapping between genes and their promoter regions were permuted 500 times. When fewer than 5 gene pairs have certain regulatory similarity, the median expression distance is computed after combining nearest regulatory similarities to make each point in the plots represent at least 5 gene pairs. The genes that share large number of common TFBMs are more likely to have correlated expression patterns: sometimes, the effect is present only when they share enough common TFBMs. Table 1 summarizes the results with 7 different distance measures. The figure and the Table 1 show that, while all other distance measures perform similar, the new distance measure correlates best with the regulatory similarity. Only the new distance measure correlates significantly with all seven data sets.
Figure 2
Figure 2
Typical co-expressed gene cluster with high correlation. The tightest gene cluster on the mice cortex developmental data is shown as a heatmap diagram; a sophisticated clustering algorithm is used with one minus correlation as the distance measure. The cluster consists 65 down regulated genes. The green column on the right side of the diagram shows the fold-change between two cortex samples at embryonic 8 days and adult age. The expression level matrix is standardized: mean subtracted and standard deviation divided; the color scheme ranges from -3 (blue, below the mean) to 3 (red, above the mean). The white color represents mean (0 value). The rows correspond to different genes, and the columns represent the experimental samples. The genes have tight linear expression pattern but their fold-changes between samples are highly variable. Such variability is a general phenomenon when one minus correlation is the distance measure.
Figure 3
Figure 3
Overview of the binding data. (a) The histogram of the number of the known TFBMs in the promoter region of 12,079 non-redundant genes. (b) The distribution of the number of common known TFBSs in the promoter regions of all 72,945,081 gene pairs in 2 mouse chips.

References

    1. Chiang DY, Brown PO, Eisen MB. Visualizing associations between genome sequences and gene expression data using genome-mean expression profiles. Bioinformatic. 2001;17:S49–55. - PubMed
    1. Bussemaker HJ, Li H, Siggia ED. Regulatory element detection using correlation with expression. Nat Genet. 2001;27:167–71. doi: 10.1038/84792. - DOI - PubMed
    1. Roven C, Bussemaker HJ. REDUCE: an online tool for inferring cis-regulatory elements and transcriptional module activities from microarray data. Nucleic Acids Research. 2003;31:3487–3490. doi: 10.1093/nar/gkg630. - DOI - PMC - PubMed
    1. Conlon EM, Liu S, Lieb JD, Liu JS. Integrating regulatory motif discovery and genome-wide expression analysis. Proc Natl Acad Sci USA. 2003;100:3339–3344. doi: 10.1073/pnas.0630591100. - DOI - PMC - PubMed
    1. Yuh CH, Bolouri H, Davidson EH. Genomic cis-regulatory logic: experimental and computational analysis of a sea urchin gene. Science. 1998;279:1896–1902. doi: 10.1126/science.279.5358.1896. - DOI - PubMed

Publication types

MeSH terms

Substances

LinkOut - more resources