. 2006 Feb 7;103(6):1750-5.
doi: 10.1073/pnas.0510509103. Epub 2006 Jan 26.

Multiple events on single molecules: unbiased estimation in single-molecule biophysics

Affiliations

Multiple events on single molecules: unbiased estimation in single-molecule biophysics

Daniel A Koster et al. Proc Natl Acad Sci U S A. .

Abstract

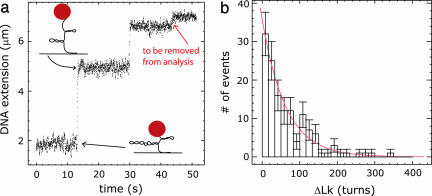
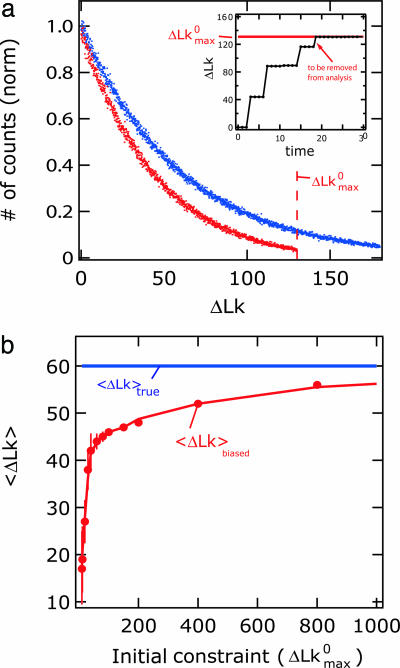
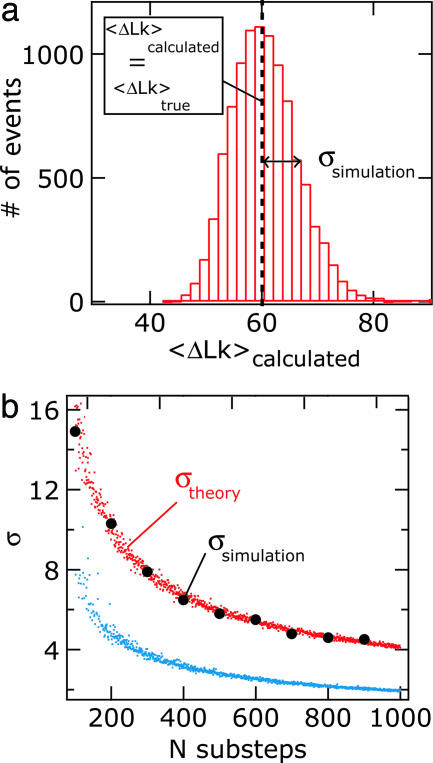
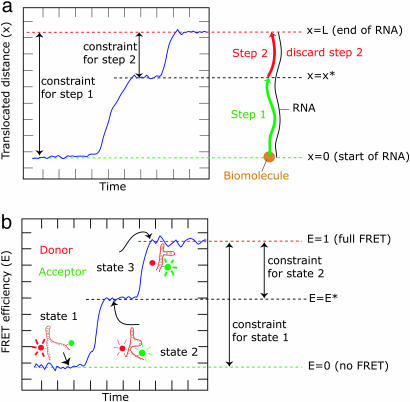
Most analyses of single-molecule experiments consist of binning experimental outcomes into a histogram and finding the parameters that optimize the fit of this histogram to a given data model. Here we show that such an approach can introduce biases in the estimation of the parameters, thus great care must be taken in the estimation of model parameters from the experimental data. The bias can be particularly large when the observations themselves are not statistically independent and are subjected to global constraints, as, for example, when the iterated steps of a motor protein acting on a single molecule must not exceed the total molecule length. We have developed a maximum-likelihood analysis, respecting the experimental constraints, which allows for a robust and unbiased estimation of the parameters, even when the bias well exceeds 100%. We demonstrate the potential of the method for a number of single-molecule experiments, focusing on the removal of DNA supercoils by topoisomerase IB, and validate the method by numerical simulation of the experiment.


Conflict of interest statement

Conflict of interest statement: No conflicts declared.

Figures

Fig. 1.
Fig. 1.
An example of a system that includes global constraints. (a) Topoisomerase IB removes DNA supercoils in steps. Each time the topoisomerase removes a number of supercoils, the DNA extension rises in a stepwise fashion. The final step that leads to the removal of the remaining supercoils in the DNA is artificially constrained and should be removed from the analysis. (b) The size of the steps (in units of change in ΔLk) is distributed exponentially. In the text, this is referred to as the measured distribution. This measured distribution may differ from an underlying true distribution because of the presence of global constraints.
Fig. 2.
Fig. 2.
Simulated step-size distributions for the enzymatic removal of supercoils from the DNA molecule. (a) The number of supercoils that the enzyme removes each time from the DNA molecule is randomly drawn from a generated exponential distribution, called the true distribution (blue dots). The true distribution is characterized by an average of 60 (units of ΔLk). After discarding the final steps leading to the level of zero supercoils ΔLkmax0 = 130, see text), one obtains a measured distribution (red dots) whose parameter is underestimated (〈ΔLk〉 = 46). (Inset) Numerical simulation of the enzymatic removal of supercoils. The size of each step is drawn from the true distribution. As in reality, the DNA molecule simulated contains only a limited number of supercoils. The level at which no supercoils are present is depicted as a horizontal red line and acts as a constraint for the removal of supercoils by the enzyme. Because the final step toward the level of zero supercoils (red arrow) is artificially constrained, this final step is removed from the data analysis (see text). (b) The degree to which the measured parameter is underestimated is a function of the constraints (the initial maximum number of supercoils in the DNA, denoted ΔLkmax0). As the constraints become more pronounced, the underestimation grows. In some cases, the underestimation of 〈ΔLk〉 caused by global constraints is severe (>100%). The true value for 〈ΔLk〉 is depicted as a horizontal blue line, which the measured value for 〈ΔLk〉 (red dots) approaches asymptotically (red line is a spline through the data points).
Fig. 3.
Fig. 3.
Recovery and error calculation of the true distribution parameter by using the maximum-likelihood method (see text). (a) The distribution of the calculated distribution parameter is generated by solving Eq. 14 for 〈ΔLk〉 106 times and binning the outcome of the calculation into bins. The distribution is peaked at the value that characterizes the unbiased step-size distribution (〈ΔLktrue). Importantly, the method thus successfully recovers the unbiased parameter despite the biasing effect of global constraints. The standard deviation of the distribution, σ, is numerically calculated. (b) The theoretical standard deviation σ, obtained by solving Eq. 15, as a function of the number of substeps per exponential distribution. The theoretical standard deviation is calculated for constrained (maximum initial ΔLkmax0 = 130, red points) and unconstrained (maximum initial ΔLkmax0 = ∞, blue points) distributions. The theoretical error in the case of the constrained distribution is compared with the error as calculated from simulations as in a and is shown as black solid circles. The theoretical error calculated by using Eq. 15 predicts the measured error very well.
Fig. 4.
Fig. 4.
Sketch of experiments in which global constraints can bias parameter estimation. (a) Processivity of a biomolecule (beige circle) along a short biopolymer such as a ssRNA or dsRNA molecule. When the biomolecule starts its procession, it has the total length of the RNA molecule (the global constraint) at its disposal (smax,0 = L). It then moves a distance x and stops. From there, it can start moving again, but the biomolecule can now only travel a length smax,0 = Lx*, before falling off the RNA. The constraint on the distance the biomolecule can travel along the RNA is different for the first and the second step. (b) Conformational changes in e.g., an RNA molecule studied by using FRET. The FRET efficiency is defined between 0 and 1, which is the global constraint for the experiment. E.g., at state 1, the FRET efficiency E = 0. From this state, the FRET efficiency can only change by 1 at maximum (smax,0 = L). However, from an arbitrary intermediate state 2 (at E = E*), it can increase its E only by smax,0 = ΔE = 1 − E*. The constraint on the change in FRET efficiency is thus different for the first and the second state, as described in the text.

References

    1. Strick T. R.,, Croquette V., Bensimon D. Nature. 2000;404:901–904. - PubMed
    1. Visscher K., Schnitzer M. J., Block S. M. Nature. 1999;400:184–189. - PubMed
    1. Yildiz A., Forkey J. N., McKinney S. A., Ha T., Goldman Y. E., Selvin P. R. Science. 2003;300:2061–2065. - PubMed
    1. Weiss S. Science. 1999;283:1676–1683. - PubMed
    1. Svoboda K., Mitra P. P., Block S. M. Proc. Natl. Acad. Sci. USA. 1994;91:11782–11786. - PMC - PubMed

Publication types

MeSH terms

Substances

LinkOut - more resources