. 2006 Feb;116(2):495-505.
doi: 10.1172/JCI25243. Epub 2006 Jan 26.

Glucocorticoids exacerbate obesity and insulin resistance in neuron-specific proopiomelanocortin-deficient mice

Affiliations

Glucocorticoids exacerbate obesity and insulin resistance in neuron-specific proopiomelanocortin-deficient mice

James L Smart et al. J Clin Invest. 2006 Feb.

Erratum in

  • J Clin Invest. 2006 Mar;116(3):842

Abstract

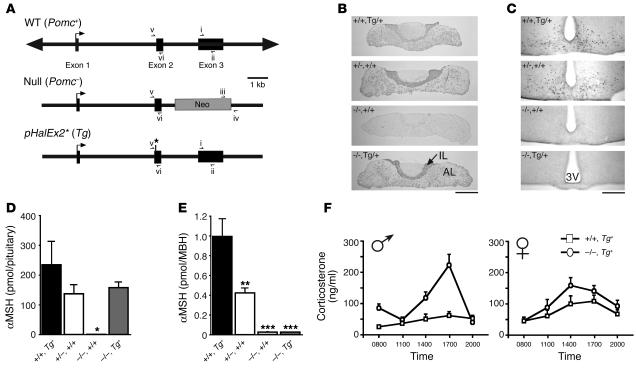
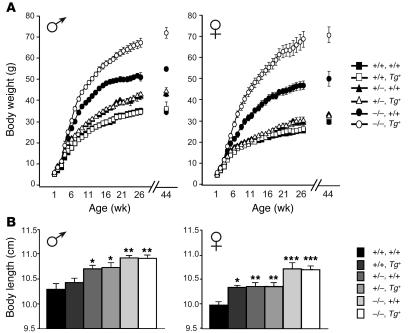
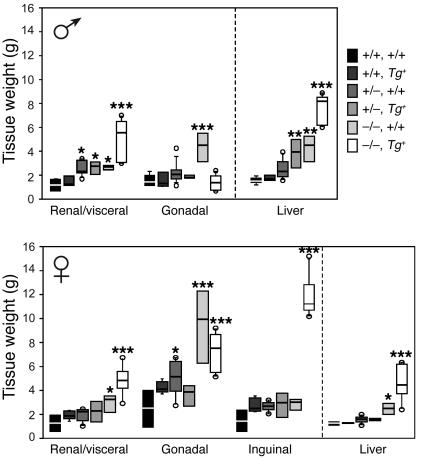
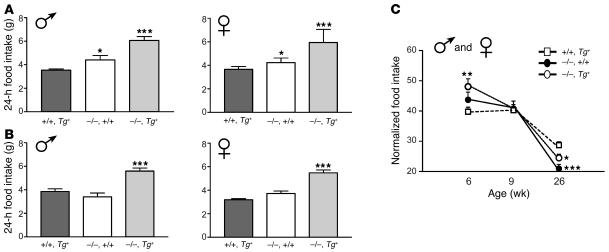
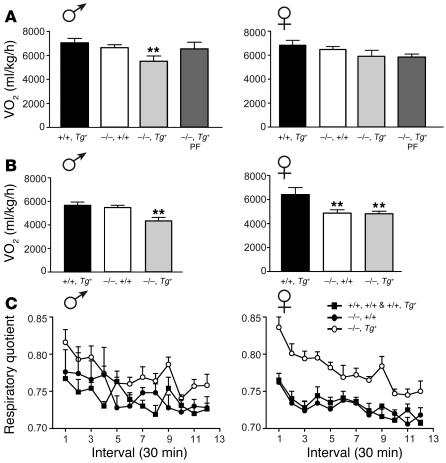
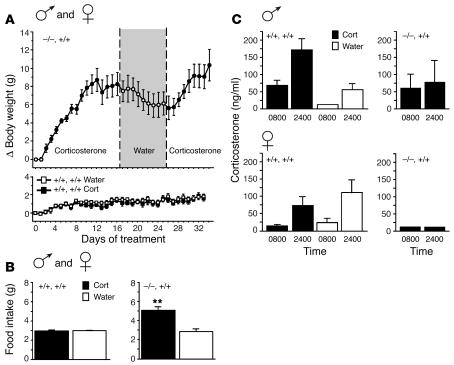
Null mutations of the proopiomelanocortin gene (Pomc) cause obesity in humans and rodents, but the contributions of central versus pituitary POMC deficiency are not fully established. To elucidate these roles, we introduced a POMC transgene (Tg) that selectively restored peripheral melanocortin and corticosterone secretion in Pomc mice. Rather than improving energy balance, the genetic replacement of pituitary POMC in PomcTg mice aggravated their metabolic syndrome with increased caloric intake and feed efficiency, reduced oxygen consumption, increased subcutaneous, visceral, and hepatic fat, and severe insulin resistance. Pair-feeding of PomcTg mice to the daily intake of lean controls normalized their rate of weight gain but did not abolish obesity, indicating that hyperphagia is a major but not sole determinant of the phenotype. Replacement of corticosterone in the drinking water of Pomc mice recapitulated the hyperphagia, excess weight gain and fat accumulation, and hyperleptinemia characteristic of genetically rescued PomcTg mice. These data demonstrate that CNS POMC peptides play a critical role in energy homeostasis that is not substituted by peripheral POMC. Restoration of pituitary POMC expression to create a de facto neuronal POMC deficiency exacerbated the development of obesity, largely via glucocorticoid modulation of appetite, metabolism, and energy partitioning.


Figures

Figure 1
Figure 1
Transgenic rescue of pituitary POMC expression. (A) Schematic of WT Pomc+, null Pomc, and pHalEx2* Tg alleles. A neomycin (Neo) selection cassette replaces exon 3 in the Pomc allele, and a 23-bp oligonucleotide (asterisk) is inserted in the 5′ untranslated region of exon 2 of the Tg allele. The arrow above exon 1 represents the transcriptional start site. PCR primer locations for genotyping of the Pomc+ (i and ii), Pomc (iii and iv), and Tg (v and vi) alleles are indicated by half-arrows. (B and C) ACTH immunoreactivity in the pituitary anterior lobe (AL), intermediate lobe (IL), and medial basal hypothalamus (MBH) from mice of the indicated genotypes. 3V, third ventricle. Scale bars: 300 μm (pituitary) and 100 μm (MBH). (D and E) Quantitation of αMSH content in the pituitary gland and MBH from male mice of the indicated genotypes (n = 4). *P < 0.01, **P < 0.001, and ***P < 0.0001 compared with Pomc+/+Tg+. (F) Basal diurnal corticosterone levels in 10- to 15-week-old male and female Pomc+/+Tg+ and Pomc–/–Tg+ mice.
Figure 2
Figure 2
The effects of rescued pituitary POMC expression on body weight and length in the Pomc–/– background. (A) Body weight curves for male and female Pomc+/+, Pomc+/–, and Pomc–/– mice with and without the pHalEx2* transgene (n = 9–44). Repeated-measures ANOVAs from 1 to 26 weeks old showed interactions between week and genotype for both sexes. Males: P < 0.0001, Pomc–/–, Pomc–/–Tg+, and Pomc+/–Tg+ compared with Pomc+/+ or Pomc+/+Tg+; P < 0.001, Pomc+/– compared with Pomc+/+ or Pomc+/+Tg+. Females: P < 0.0001, Pomc–/– and Pomc–/–Tg+ compared with Pomc+/+ or Pomc+/+Tg+. (B) Body lengths of males at age 44 ± 1.3 weeks and females at age 59 ± 2 weeks differed by genotype (F5,44 = 5.9, P < 0.0005, and F5,37 = 13.4, P < 0.0001, respectively). *P < 0.01, **P < 0.001, and ***P < 0.0001 compared with Pomc+/+.
Figure 3
Figure 3
Weights of adipose tissue and liver from male and female Pomc+/+, Pomc+/–, and Pomc–/– mice with and without pHalEx2* transgene expression. Adipose depots are the combined renal/visceral, gonadal, and subcutaneous inguinal white fat pads. The box and whisker plots show the 10th, 25th, 50th (median), 75th, and 90th percentiles and individual outlying data points (open circles). Males, age 41 ± 1 weeks (n = 3–10). Females, age 55 ± 1.7 weeks (n = 4–6). *P < 0.05, **P < 0.01, and ***P < 0.0001 compared with Pomc+/+.
Figure 4
Figure 4
Food intake in Pomc+/+Tg+, Pomc–/–, and Pomc–/–Tg+ mice provided ad libitum access to chow. (A and B) There were genotype differences in 24-hour food intake in 6-week-old males (F2,17 = 25.8, P < 0.0001) and females (F2,15 = 5.418, P < 0.05) (A) and in 26-week-old males (F2,19 = 20.2, P < 0.0001) and females (F2,21 = 30.5, P < 0.0001) (B). (C) Genotype differences were also observed in 24-hour food intake corrected for metabolic mass ([food intake (g)]/[body weight (g)]0.75 × 100) at ages 6 weeks (F2,32 = 4.1, P < 0.05) and 26 weeks (F2,45 = 6.6, P < 0.005) but not at age 9 weeks (F2,21 = 0.2, P = 0.82) (males and females combined). *P < 0.05, **P < 0.01, and ***P < 0.001 compared with Pomc+/+Tg+.
Figure 5
Figure 5
Basal metabolic rate and RQ. (A and B) Basal metabolic rate measured by VO2 consumption corrected for metabolic mass (ml/kg0.75/h) in 10-week-old (A) and 30-week-old (B) mice (n = 5–9). Basal metabolic rate differed by genotype in males (F3,18 = 3.2, P < 0.05) but not females (F3,20 = 1.7, P = 0.19) at age 10 weeks (A) and in both males (F2,18 = 6.1, P < 0.01) and females (F2,18 = 6.8, P < 0.01) at age 30 weeks (B). PF, pair-fed. **P < 0.01 compared with Pomc+/+Tg+. (C) RQ was higher in both male and female Pomc–/–Tg+ compared with Pomc–/– and Pomc+/+Tg+ mice at age 30 weeks. Repeated-measures ANOVAs showed a main effect of genotype for males (F2,198 = 3.4, P = 0.05) and females (F2,198 = 24.6, P < 0.0001).
Figure 6
Figure 6
Growth curves, fat mass, and plasma leptin levels of individually housed Pomc+/+Tg+, Pomc–/–, and Pomc–/–Tg+ mice from ages 5 to 15 weeks. (A) The effect on body weight of pair-feeding (PF) of Pomc–/–Tg+ mice to the daily food intake of Pomc+/+Tg+ mice starting at age 5 weeks (n = 5–11). Repeated-measures ANOVAs over the 10-week period showed a main effect of group for males (F18,117 = 21.5, P < 0.0001) and females (F18,144 = 24.6, P < 0.0001). One-factor ANOVAs showed that Pomc–/–Tg+ pair-fed mice differed from Pomc–/–Tg+ mice fed ad libitum and Pomc+/+Tg+ mice fed ad libitum (P < 0.001); Pomc–/– mice fed ad libitum also differed from Pomc+/+Tg+ mice fed ad libitum and Pomc–/–Tg+ mice fed ad libitum (P < 0.001) but not from Pomc–/–Tg+ pair-fed mice. (B) The effects of pair-feeding of Pomc–/–Tg+ mice on accumulation of fat mass. The combined weight of 4 white fat pads (renal, visceral, gonadal, and inguinal) was different among groups in 15- to 20-week-old male (F3,17 = 50.3, P < 0.0001) and female (F3,23 = 35.9, P < 0.0001) mice. *P < 0.05, **P < 0.001, and ***P < 0.0001 compared with Pomc+/+Tg+; #P < 0.0001 compared with Pomc–/–Tg+. (C and D) The effect of pair-feeding of Pomc–/–Tg+ mice on plasma leptin levels. Data are the means and scattergrams of all individual leptin levels (n = 9–19) obtained after a 16-hour overnight fast in 9-week-old (C) and ad libitum–fed 15- to 20-week-old (D) mice of both sexes.
Figure 7
Figure 7
The effect on body weight, food intake, and plasma corticosterone levels of corticosterone (Cort) replacement (25 μg/ml drinking water) in Pomc–/– and C57BL/6J Pomc+/+ mice starting at age 6–9 weeks. Pomc+/+ mice (n = 20; 10 males and 10 females) were separated into 2 groups and received either water (n = 10) or corticosterone (n = 10) for 34 consecutive days. All Pomc–/– mice (n = 5; 3 males and 2 females) were first given corticosterone (days 1–16, filled circles), then water (days 16–25, open circles), and finally corticosterone again (days 25–34, filled circles). (A) Weight gain was significantly accelerated by corticosterone replacement in Pomc–/– mice but was unaltered in Pomc+/+ mice of either sex. (B) Average daily food intake measured over a 7-day period was increased in Pomc–/– mice (corticosterone versus water, **P = 0.01, paired t test) but was unchanged by corticosterone treatment in Pomc+/+ mice. (C) Plasma corticosterone levels obtained under stress-free conditions at 0800 and 2400 hours. Corticosterone was always less than 12.5 ng/ml (assay sensitivity) for Pomc–/– mice without replacement (data not shown).

References

    1. Isomaa B. A major health hazard: the metabolic syndrome. Life Sci. 2003;73:2395–2411. - PubMed
    1. Havel PJ. Peripheral signals conveying metabolic information to the brain: short-term and long-term regulation of food intake and energy homeostasis. Exp. Biol. Med. 2001;226:963–977. - PubMed
    1. Dallman MF, et al. A spoonful of sugar: feedback signals of energy stores and corticosterone regulate responses to chronic stress. Physiol. Behav. 2003;79:3–12. - PubMed
    1. Low MJ. Role of proopiomelanocortin neurons and peptides in the regulation of energy homeostasis. J. Endocrinol. Invest. 2004;27:95–100. - PubMed
    1. Ellacott KL, Cone RD. The central melanocortin system and the integration of short- and long-term regulators of energy homeostasis. Recent Prog. Horm. Res. 2004;59:395–408. - PubMed

Publication types