. 2005 Nov 23;5(10):783-92.
doi: 10.1167/5.10.3.

Stereo sensitivity depends on stereo matching

Affiliations

Stereo sensitivity depends on stereo matching

Suzanne P McKee et al. J Vis. .

Abstract

Stereoacuity thresholds, measured with bar targets, rise as the absolute disparity of the bars is increased. One explanation for this rise is that, as the bars are moved away from the fixation plane, the stereo system uses coarser mechanisms to encode the bars' disparity; coarse mechanisms are insensitive to small changes in target disparity, resulting in higher thresholds. To test this explanation, we measured stereoacuity with a 6 degrees wide 3 cpd grating presented in a rectangular envelope. We varied the disparity of the grating and its edges (envelope) parametrically from 0 to 20 arcmin (i.e., through one full period). To force observers to make judgments based on carrier disparity, we then varied the interocular phase incrementally from trial-to-trial while keeping edge disparity fixed for a given block of trials. The pedestal phase disparity of the grating necessarily cycles through 360 degrees, back to zero disparity, as the edge disparity increases monotonically from 0 to 20 arcmin. Unlike mechanisms that respond to bars, the mechanism that responds to the interocular phase disparity of the grating should have the same sensitivity at 20 arcmin disparity (360 degrees of phase) as it has at zero disparity. So, if stereoacuity were determined by the most sensitive mechanism, thresholds should oscillate with the pedestal phase disparity. However, these gratings are perceived in depth at the disparity of their edges. If stereoacuity were instead determined by the stereo matching operations that generate perceived depth, thresholds should rise monotonically with increasing edge disparity. We found that the rise in grating thresholds with increasing edge disparity was monotonic and virtually identical to the rise in thresholds observed for bars. Stereoacuity is contingent on stereo matching.


Figures

Figure 1
Figure 1
Diagram of stereoscopic half-images of grating (see text).
Figure 2
Figure 2
Disparity thresholds as a function of the absolute disparity of the targets. Left graph: thresholds for grating. Right graph: thresholds for bar.
Figure 3
Figure 3
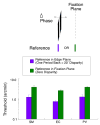
Purple bars show disparity thresholds when target grating and reference are located in same plane at an edge disparity of 20 arcmin, equal to one full period of 3 cpd grating. Green bars show disparity thresholds when test grating remains at 20 arcmin disparity but reference is located in the fixation plane.
Figure 4
Figure 4
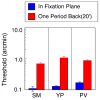
Interocular phase disparity thresholds for 3 cpd test grating with second grating serving as reference. Blue bars: test and reference gratings presented in the fixation plane (edge disparity = 0 arcmin). Red bars: test and reference gratings presented one period behind fixation plane (edge disparity = 20 arcmin). Interocular phase of upper test grating was varied in small increments around zero phase from trial to trial. Gratings were separated vertically by 1°.
Figure 5
Figure 5
Disparity thresholds in fixation plane as a function of spatial frequency; data for two subjects. Leftmost point is for a luminous rectangle (‘Box’) equal in extent to the gratings (6° wide). Target duration was 500 ms. Grating contrast was 50%.
Figure 6
Figure 6
Disparity thresholds as a function of contrast for 3 cpd, 6° wide grating with edges in fixation plane (blue squares) and for the same grating with edge disparity of 20 arcmin, equal to one grating period. Reference was small black bar presented in edge plane, 1° below grating.
Figure 7
Figure 7
Blue bars in all three histograms are for a 3 cpd, 6° wide grating presented in the fixation plane; red bars are for grating presented with an edge disparity of 20 arcmin. Left: disparity thresholds; reference presented in same plane as grating edges. Center: contrast increment thresholds, expressed as percentage change in 50% contrast; right: spatial frequency discrimination thresholds, expressed in arcmin difference in periods.

Similar articles

Cited by

References

    1. Badcock DR, Schor CM. Depth-increment detection function for individual spatial channels. Journal of the Optical Society of America A. 1985;2:1211–1216. [PubMed] - PubMed
    1. Blakemore C. The range and scope of binocular depth discrimination in man. Journal of Physiology. 1970;211:599–622. [PubMed] - PMC - PubMed
    1. Bredfeldt, C., & Cumming, B. G. (2005). Explaining cyclopean edge selectivity in macaque area V2. Abstract CoSyne Meeting, March, 2005.
    1. Cumming BG, Parker AJ. Binocular neurons in V1 of awake monkeys are selective for absolute, not relative, disparity. Journal of Neuroscience. 1999;19:5602–5618. [PubMed] - PMC - PubMed
    1. Cumming BG, Parker AJ. Local disparity not perceived depth is signaled by binocular neurons in cortical area V1 of the Macaque. Journal of Neuroscience. 2000;19:5602–5618. [PubMed] - PMC - PubMed

Publication types