

Conformational change of bacteriorhodopsin quantitatively monitored by microcantilever sensors
- PMID: 16443650
- PMCID: PMC1414560
- DOI: 10.1529/biophysj.105.072934
Conformational change of bacteriorhodopsin quantitatively monitored by microcantilever sensors
Abstract
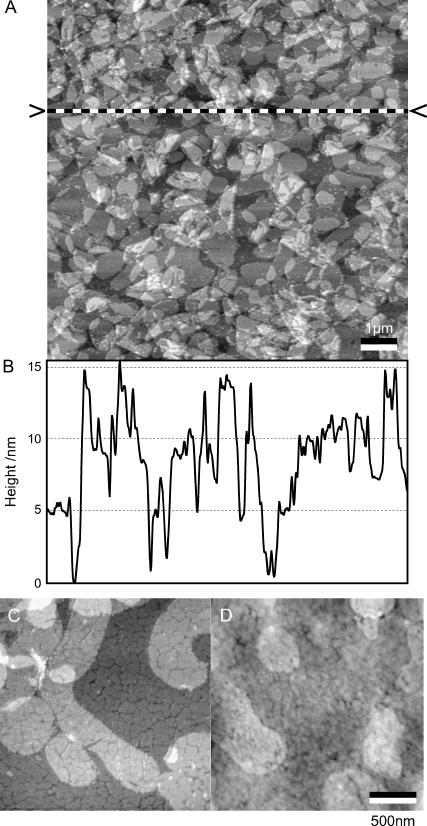
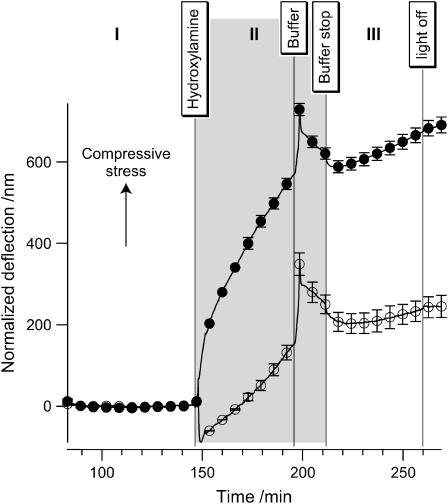
Bacteriorhodopsin proteoliposomes were used as a model system to explore the applicability of micromechanical cantilever arrays to detect conformational changes in membrane protein patches. The three main results of our study concern: 1), reliable functionalization of micromechanical cantilever arrays with proteoliposomes using ink jet spotting; 2), successful detection of the prosthetic retinal removal (bleaching) from the bacteriorhodopsin protein by measuring the induced nanomechanical surface stress change; and 3), the quantitative response thereof, which depends linearly on the amount of removed retinal. Our results show this technique to be a potential tool to measure membrane protein-based receptor-ligand interactions and conformational changes.
Figures


Similar articles
-
Direct observation of protein motion during the photochemical reaction cycle of bacteriorhodopsin.Langmuir. 2007 Jun 19;23(13):7225-8. doi: 10.1021/la700666p. Epub 2007 May 16. Langmuir. 2007. PMID: 17503866
-
Force-induced conformational change of bacteriorhodopsin.J Mol Biol. 1995 Jun 2;249(2):239-43. doi: 10.1006/jmbi.1995.0292. J Mol Biol. 1995. PMID: 7783190
-
Preliminary ultrasonication affects the rate of the bacteriorhodopsin bleaching and the effectiveness of the reconstitution process in bacterioopsin.Photochem Photobiol. 2014 Sep-Oct;90(5):1207-10. doi: 10.1111/php.12275. Epub 2014 Apr 21. Photochem Photobiol. 2014. PMID: 24678657
-
X-ray diffraction of bacteriorhodopsin photocycle intermediates.Mol Membr Biol. 2004 May-Jun;21(3):143-50. doi: 10.1080/09687680410001666345. Mol Membr Biol. 2004. PMID: 15204622 Review.
-
Microcantilever biosensors based on conformational change of proteins.Analyst. 2008 Apr;133(4):434-43. doi: 10.1039/b713330h. Epub 2008 Feb 25. Analyst. 2008. PMID: 18365110 Review.
Cited by
-
Sensing surface PEGylation with microcantilevers.Beilstein J Nanotechnol. 2010;1:3-13. doi: 10.3762/bjnano.1.2. Epub 2010 Nov 22. Beilstein J Nanotechnol. 2010. PMID: 21977390 Free PMC article.
-
Rapid and Ultrasensitive Detection of Mutations and Genes Relevant to Antimicrobial Resistance in Bacteria.Glob Chall. 2020 Nov 30;5(2):2000066. doi: 10.1002/gch2.202000066. eCollection 2021 Feb. Glob Chall. 2020. PMID: 33552553 Free PMC article.
-
Isolation of a new Pseudomonas halophila strain possess bacteriorhodopsin-like protein by a novel method for screening of photoactive protein producing bacteria.World J Microbiol Biotechnol. 2014 Feb;30(2):585-94. doi: 10.1007/s11274-013-1453-7. Epub 2013 Sep 4. World J Microbiol Biotechnol. 2014. PMID: 24002576
-
Direct detection of a BRAF mutation in total RNA from melanoma cells using cantilever arrays.Nat Nanotechnol. 2013 Feb;8(2):125-9. doi: 10.1038/nnano.2012.263. Epub 2013 Feb 3. Nat Nanotechnol. 2013. PMID: 23377457
-
Silicon Microcantilever Sensors to Detect the Reversible Conformational Change of a Molecular Switch, Spiropyan.Sensors (Basel). 2020 Feb 6;20(3):854. doi: 10.3390/s20030854. Sensors (Basel). 2020. PMID: 32041095 Free PMC article.
References
-
- Williams, M. 2003. Target validation. Curr. Opin. Pharmacol. 3:571–577. - PubMed
-
- Wise, A., K. Gearing, and S. Rees. 2002. Target validation of g-protein coupled receptors. Drug Discov. Today. 7:235–246. - PubMed
-
- Alberts, B., A. Johnson, J. Lewis, M. Raff, K. Roberts, and P. Walter. 2002. The Molecular Biology of the Cell. Garland Science, New York.
-
- Nelson, B. P., T. E. Grimsrud, M. R. Liles, R. M. Goodman, and R. M. Corn. 2001. Surface plasmon resonance imaging measurements of DNA and RNA hybridization adsorption onto DNA microarrays. Anal. Chem. 73:1–7. - PubMed
-
- Bizet, K., C. Gabrielli, H. Perrot, and J. Therasse. 1998. Validation of antibody-based recognition by piezoelectric transducers through electroacoustic admittance analysis. Biosens. Bioelectron. 13:259–269. - PubMed
Publication types
MeSH terms
Substances
LinkOut - more resources
Full Text Sources
