. 2006 Apr 15;90(8):2796-807.
doi: 10.1529/biophysj.105.075697. Epub 2006 Jan 27.

Simulation-based methods for interpreting x-ray data from lipid bilayers

Affiliations

Simulation-based methods for interpreting x-ray data from lipid bilayers

Jeffery B Klauda et al. Biophys J. .

Abstract

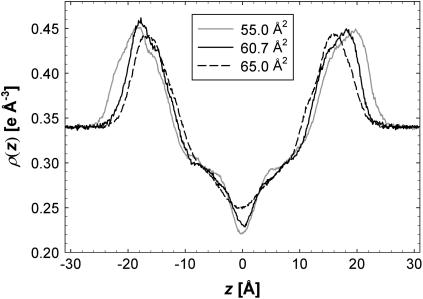
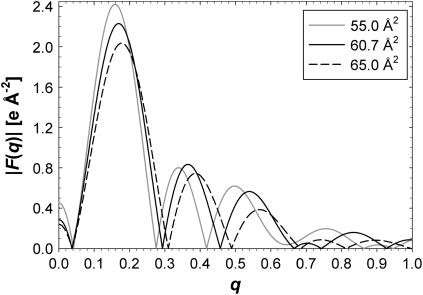
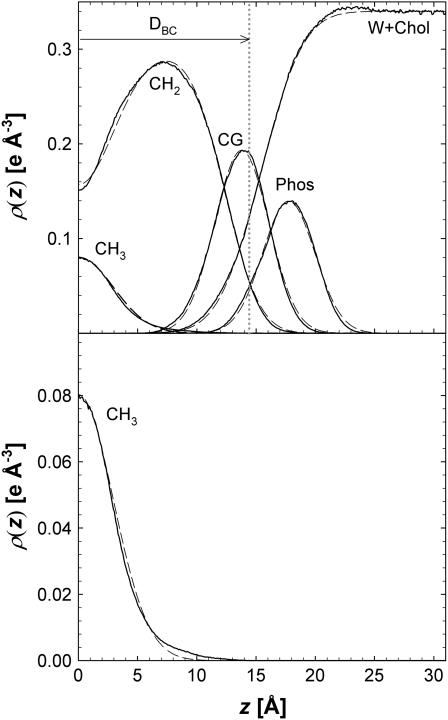
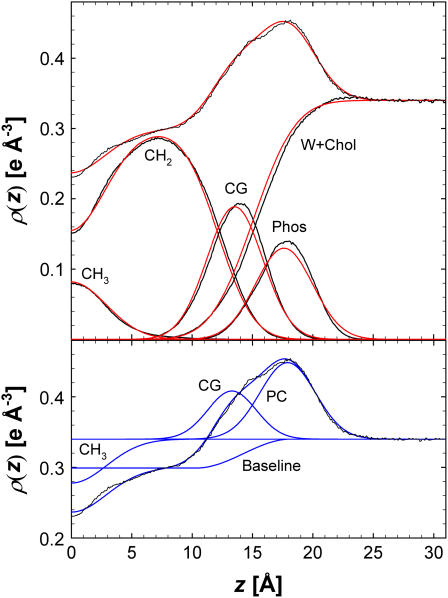
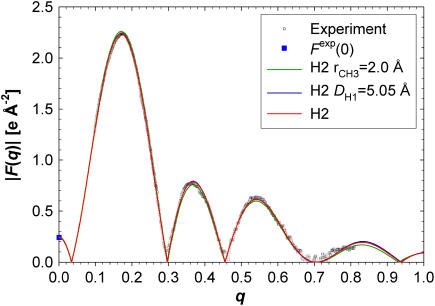
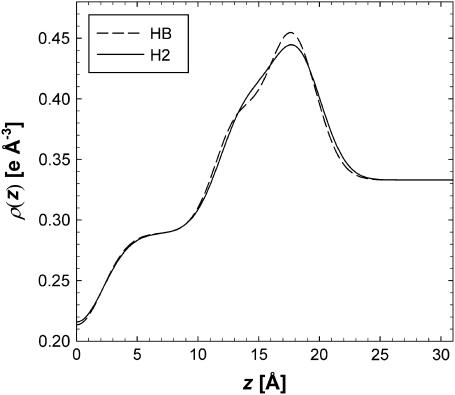
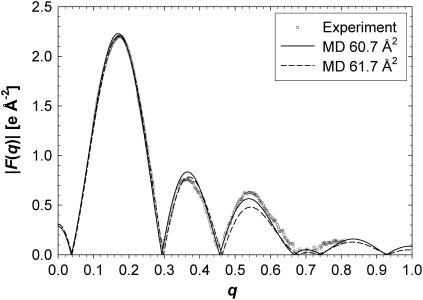
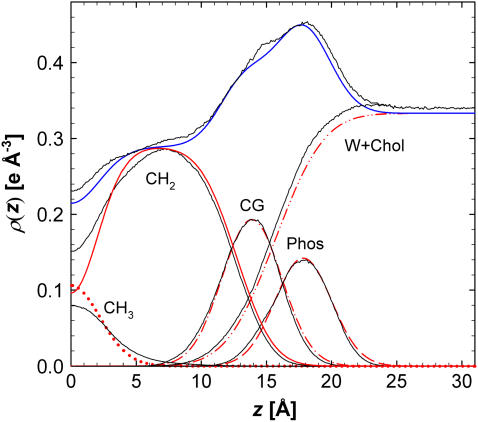
The fully hydrated liquid crystalline phase of the dimyristoylphosphatidycholine lipid bilayer at 30 degrees C was simulated using molecular dynamics with the CHARMM potential for five surface areas per lipid (A) in the range 55-65 A(2) that brackets the previously determined experimental area 60.6 A(2). The results of these simulations are used to develop a new hybrid zero-baseline structural model, denoted H2, for the electron density profile, rho(z), for the purpose of interpreting x-ray diffraction data. H2 and also the older hybrid baseline model were tested by fitting to partial information from the simulation and various constraints, both of which correspond to those available experimentally. The A, rho(z), and F(q) obtained from the models agree with those calculated directly from simulation at each of the five areas, thereby validating this use of the models. The new H2 was then applied to experimental dimyristoylphosphatidycholine data; it yields A = 60.6 +/- 0.5 A(2), in agreement with the earlier estimate obtained using the hybrid baseline model. The electron density profiles also compare well, despite considerable differences in the functional forms of the two models. Overall, the simulated rho(z) at A = 60.7 A(2) agrees well with experiment, demonstrating the accuracy of the CHARMM lipid force field; small discrepancies indicate targets for improvements. Lastly, a simulation-based model-free approach for obtaining A is proposed. It is based on interpolating the area that minimizes the difference between the experimental F(q) and simulated F(q) evaluated for a range of surface areas. This approach is independent of structural models and could be used to determine structural properties of bilayers with different lipids, cholesterol, and peptides.


Figures

FIGURE 1
FIGURE 1
Normalized atomic form factors fi(q)/fi(0) for carbon, oxygen, phosphorus, and nitrogen atoms within the experimental q-range (0 < q < 0.8 Å−1).
FIGURE 2
FIGURE 2
The bottom panel shows the component probabilities for the A = 60.7 Å2 simulation, pm(z) along the bilayer normal z for water (w), choline (chol), phosphate (phos), glycerol (gly), and carbonyls (co) on the left, and on the right for combinations of some of these components, phosphate + choline (PC), carbonyl + glycerol (CG), and water + choline, with chain methylenes (CH2) and terminal methyls (CH3) and their sum in the middle. The Gibbs dividing surfaces are indicated by vertical dashed lines labeled DC for the hydrocarbon boundary and 0.5DB for the Luzzati water boundary. The top panel shows deviations of ptot(zi) from unity with the right half from the six-component analysis and the left half from the seven-component analysis.
FIGURE 3
FIGURE 3
The electron density profiles, ρ(z), as a function of z along the bilayer normal for simulated areas 55 (solid gray), 60.7 (solid black), and 65 Å2 (dashed black).
FIGURE 4
FIGURE 4
Form factors, F(q), from three of the five simulated areas, 55 (solid gray), 60.7 (solid black), and 65 Å2 (dashed black).
FIGURE 5
FIGURE 5
Results of independently fitting Gaussians to the phosphate, terminal methyl, and CG distributions and the other functional forms in H2 to the water + choline and methylene distributions for the A = 60.7 Å2 simulation. The solid lines are results from MD and the dashed H2. The bottom panel shows the terminal methyl distribution on an expanded scale.
FIGURE 6
FIGURE 6
Results of fitting H2 (top panel in red) and HB (bottom panel in blue) for A = 60.7 Å2 with the total ρ(z) and the component ρ(z) (simulation results in black). The CG, PC, and CH3 component contributions for the HB model are shown as differences from the water level ρW and the total electron density is the sum of the baseline and the component contributions.
FIGURE 7
FIGURE 7
H2 form factors fit to the experimental F(q). The red H2 curve shows the result for the parameters in Table 4 and the other two H2 plots are for the altered values of DH1 and r given in the legend.
FIGURE 8
FIGURE 8
Comparison of the ρ(z) obtained from HB and H2 (from Table 4) fit to experimental form factors.
FIGURE 9
FIGURE 9
A comparison of the experimental form factors (6) with those from simulations at two areas. The experimental F(q) was scaled to MD 60.7 Å2 and MD 61.7 Å2 was artificially rescaled to the experimental F(q) to better view the residuals for that simulation.
FIGURE 10
FIGURE 10
The ρ(z) obtained from the structural models fit to the experimental F(q); average of H2 and HB (blue) and components of H2 (red). The black curves show the simulations for A = 60.7 Å2.

References

    1. Janiak, M. J., D. M. Small, and G. G. Shipley. 1979. Temperature and compositional dependence of the structure of hydrated dimyristoyl lecithin. J. Biol. Chem. 254:6068–6078. - PubMed
    1. McIntosh, T. J., and S. A. Simon. 1986. Area per molecule and distribution of water in fully hydrated dilauroylphosphatidylethanolamine bilayers. Biochemistry. 25:4948–4952. - PubMed
    1. Nagle, J. F., and S. Tristram-Nagle. 2000. Structure of lipid bilayers. Biochim. Biophys. Acta. 1469:159–195. - PMC - PubMed
    1. Wiener, M. C., and S. H. White. 1991. Fluid bilayer structure determination by the combined use of x-ray and neutron-diffraction II. Composition-space refinement method. Biophys. J. 59:174–185. - PMC - PubMed
    1. Wilkins, M. H. F., A. E. Blaurock, and D. M. Engelman. 1971. Bilayer structure in membranes. Nat. New Biol. 230:72–76. - PubMed

Publication types

MeSH terms

Substances

LinkOut - more resources