

Low amounts of sucrose are sufficient to depress the phase transition temperature of dry phosphatidylcholine, but not for lyoprotection of liposomes
- PMID: 16443655
- PMCID: PMC1414563
- DOI: 10.1529/biophysj.105.074427
Low amounts of sucrose are sufficient to depress the phase transition temperature of dry phosphatidylcholine, but not for lyoprotection of liposomes
Abstract
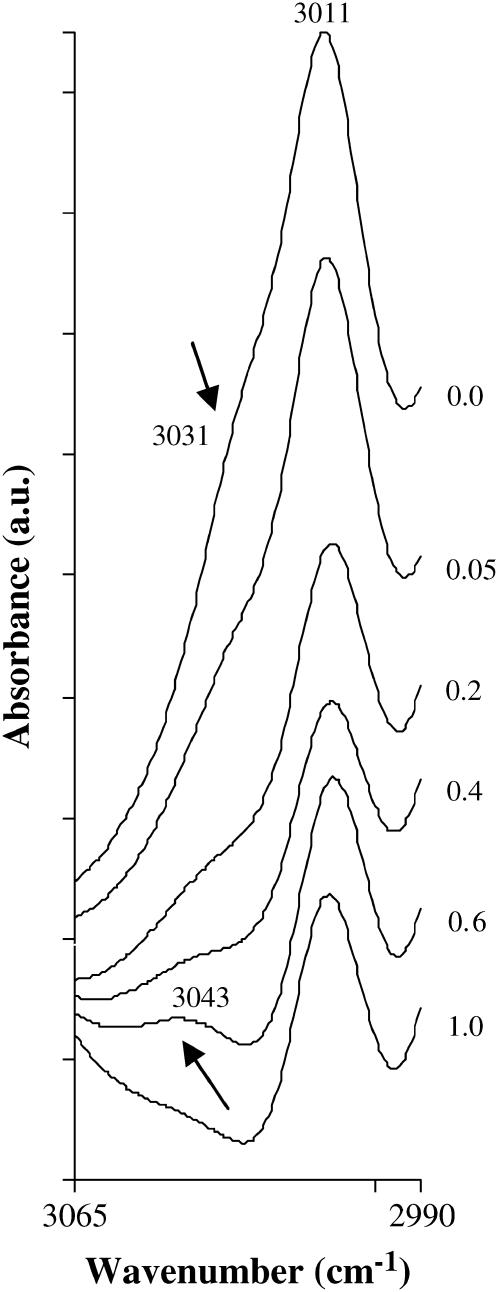
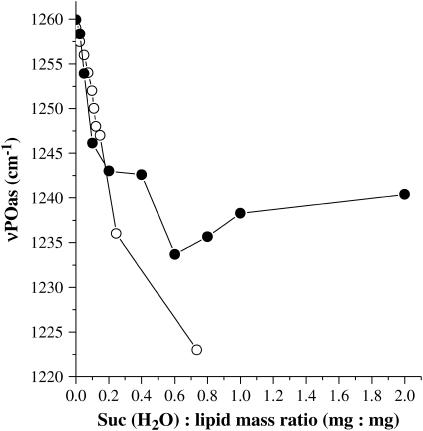
Disaccharides such as sucrose and trehalose play an important role in stabilizing cellular structures during dehydration. In fact, most organisms that are able to survive desiccation accumulate high concentrations of sugars in their cells. The mechanisms involved in the stabilization of cellular membranes in the dry state have been investigated using model membranes, such as phosphatidylcholine liposomes. It has been proposed that the lyoprotection of liposomes depends on the depression of the gel to liquid-crystalline phase transition temperature (T(m)) of the dry membranes below ambient and on the prevention of membrane fusion by sugar glass formation, because both lead to leakage of soluble content from the liposomes. Since fusion is prevented at lower sugar/lipid mass ratios than leakage, it has been assumed that more sugar is needed to depress T(m) than to prevent fusion. Here, we show that this is not the case. In air-dried egg phosphatidylcholine liposomes, T(m) is depressed by >60 degrees C at sucrose/lipid mass ratios 10-fold lower than those needed to depress fusion to below 20%. In fact, T(m) is significantly reduced at mass ratios where no bulk sugar glass phase is detectable by Fourier transform infrared spectroscopy or differential scanning calorimetry. A detailed analysis of the interactions of sucrose with the P=O, C=O, and choline groups of the lipid and a comparison to published data on water binding to phospholipids suggests that T(m) is reduced by sucrose through a "water replacement" mechanism. However, the sucrose/lipid mass ratios necessary to prevent leakage exceed those necessary to prevent both phase transitions and membrane fusion. We hypothesize that kinetic phenomena during dehydration and rehydration may be responsible for this discrepancy.
Figures


Similar articles
-
The preservation of liposomes by raffinose family oligosaccharides during drying is mediated by effects on fusion and lipid phase transitions.Biochim Biophys Acta. 2003 Jun 10;1612(2):172-7. doi: 10.1016/s0005-2736(03)00116-0. Biochim Biophys Acta. 2003. PMID: 12787935
-
Stabilization of dry membranes by mixtures of hydroxyethyl starch and glucose: the role of vitrification.Cryobiology. 1997 Aug;35(1):20-30. doi: 10.1006/cryo.1997.2020. Cryobiology. 1997. PMID: 9302765
-
Dehydrating phospholipid vesicles measured in real-time using ATR Fourier transform infrared spectroscopy.Cryobiology. 2010 Aug;61(1):108-14. doi: 10.1016/j.cryobiol.2010.06.001. Epub 2010 Jun 8. Cryobiology. 2010. PMID: 20566369
-
The role of vitrification in anhydrobiosis.Annu Rev Physiol. 1998;60:73-103. doi: 10.1146/annurev.physiol.60.1.73. Annu Rev Physiol. 1998. PMID: 9558455 Review.
-
Looking beyond sugars: the role of amphiphilic solutes in preventing adventitious reactions in anhydrobiotes at low water contents.Comp Biochem Physiol A Mol Integr Physiol. 2002 Mar;131(3):515-25. doi: 10.1016/s1095-6433(01)00514-1. Comp Biochem Physiol A Mol Integr Physiol. 2002. PMID: 11867277 Review.
Cited by
-
Long-Circulating and Fusogenic Liposomes Loaded with Paclitaxel and Doxorubicin: Effect of Excipient, Freezing, and Freeze-Drying on Quality Attributes.Pharmaceutics. 2022 Dec 27;15(1):86. doi: 10.3390/pharmaceutics15010086. Pharmaceutics. 2022. PMID: 36678715 Free PMC article.
-
Caprylate-conjugated Cisplatin for the development of novel liposomal formulation.AAPS PharmSciTech. 2014 Aug;15(4):845-57. doi: 10.1208/s12249-014-0106-y. Epub 2014 Apr 4. AAPS PharmSciTech. 2014. PMID: 24700295 Free PMC article.
-
Fructan and its relationship to abiotic stress tolerance in plants.Cell Mol Life Sci. 2009 Jul;66(13):2007-23. doi: 10.1007/s00018-009-0002-x. Epub 2009 Mar 17. Cell Mol Life Sci. 2009. PMID: 19290476 Free PMC article. Review.
-
On the decrease in lateral mobility of phospholipids by sugars.Biophys J. 2007 Mar 1;92(5):1598-605. doi: 10.1529/biophysj.106.096461. Epub 2006 Dec 1. Biophys J. 2007. PMID: 17142271 Free PMC article.
-
Cold Acclimation Favors Metabolic Stability in Drosophila suzukii.Front Physiol. 2018 Nov 1;9:1506. doi: 10.3389/fphys.2018.01506. eCollection 2018. Front Physiol. 2018. PMID: 30443218 Free PMC article.
References
-
- Oliver, A. E., L. M. Crowe, and J. H. Crowe. 1998. Methods for dehydration tolerance: depression of the phase transition temperature in dry membranes and carbohydrate vitrification. Seed Sci. Res. 8:211–221.
-
- Oliver, A. E., D. K. Hincha, and J. H. Crowe. 2002. Looking beyond sugars: the role of amphiphilic solutes in preventing adventitious reactions in anhydrobiotes at low water contents. Comp. Biochem. Physiol. 131A:515–525. - PubMed
-
- Crowe, J. H., F. A. Hoekstra, and L. M. Crowe. 1992. Anhydrobiosis. Annu. Rev. Physiol. 54:579–599. - PubMed
-
- Lapinski, J., and A. Tunnacliffe. 2003. Anhydrobiosis without trehalose in bdelloid rotifers. FEBS Lett. 553:387–390. - PubMed
-
- Crowe, J. H., F. Tablin, W. F. Wolkers, K. Gousset, N. Tsvetkova, and J. Ricker. 2003. Stabilization of membranes in human platelets freeze-dried with trehalose. Chem. Phys. Lipids. 122:41–52. - PubMed
Publication types
MeSH terms
Substances
LinkOut - more resources
Full Text Sources
Other Literature Sources
