. 2006 Apr 15;90(8):2938-45.
doi: 10.1529/biophysj.105.076505. Epub 2006 Jan 27.

Synthesis of voltage-sensitive optical signals: application to panoramic optical mapping

Affiliations

Synthesis of voltage-sensitive optical signals: application to panoramic optical mapping

Martin J Bishop et al. Biophys J. .

Abstract

Fluorescent photon scattering is known to distort optical recordings of cardiac transmembrane potentials; however, this process is not well quantified, hampering interpretation of experimental data. This study presents a novel model, which accurately synthesizes fluorescent recordings over the irregular geometry of the rabbit ventricles. Using the model, the study aims to provide quantification of fluorescent signal distortion for different optical characteristics of the preparation and of the surrounding medium. A bi-domain representation of electrical activity is combined with finite element solutions to the photon diffusion equation simulating both the excitation and emission processes, along with physically realistic boundary conditions at the epicardium, which allow simulation of different experimental setups. We demonstrate that distortion in the optical signal as a result of fluorescent photon scattering is truly a three-dimensional phenomenon and depends critically upon the geometry of the preparation, the scattering properties of the tissue, the direction of wavefront propagation, and the specifics of the experimental setup. Importantly, we show that in an anatomically accurate model of ventricular geometry and fiber orientation, the morphology of the optical signal does not provide reliable information regarding the intramural direction of wavefront propagation. These findings underscore the potential of the new model in interpreting experimental data.


Figures
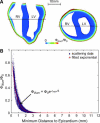
FIGURE 1
FIGURE 1
(A) Distribution of Φillum throughout the three-dimensional volume of the ventricles due to uniform epicardial illumination, showing the attenuation of the signal with depth into the myocardial wall. Locations of the slices through the ventricles are shown to be: apex-base (left) and anterior-posterior (right). The dashed-line in the apex-base slice refers to the position of the anterior-posterior slice; the dashed-line in the anterior-posterior slice refers to the position of the apex-base slice. (B) Plot of Φillum at each node point against the minimum geometric distance (rmin) of that point from the epicardium, along with a monoexponential decay function formula image with δ = 0.57 mm.
FIGURE 2
FIGURE 2
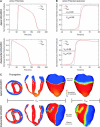
Vm activation maps after apical (top) and endocardial (bottom) stimulation. Arrows in transmural views indicate the direction of wavefront propagation. Crosses mark the epicardial node from which the action potentials in Fig. 3 were recorded. Locations of the slices through the ventricles are apex-base (left) and anterior-posterior (right) as shown in Fig. 1.
FIGURE 3
FIGURE 3
Epicardial transmembrane electrical activity (Vm) and fluorescent optical signal (Vopt) after apical (top) and endocardial (bottom) stimulus. (A) Vm and Vopt action potentials taken from epicardial node marked in Fig. 2, with the upstroke region highlighted in B. (C) Surface distribution of Vm (left) and Vopt (right) 50 ms after apical stimulation (top) and 6 ms after endocardial stimulation (bottom), including transmural views. Locations of the slices through the ventricles for the Vm images are apex-base (right) and anterior-posterior (left) as shown in Fig. 1.
FIGURE 4
FIGURE 4
Variation of τopt with Reff for apical (solid line, circles) and endocardial (dashed line, squares) stimulation protocols for the partial current boundary condition. Zero boundary condition solutions are also shown for the corresponding cases (solid line for apical, dashed line for endocardial stimulation).
FIGURE 5
FIGURE 5
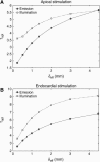
Variation of τopt as the scattering properties of the tissue are varied. The penetration depth δeff (defined as formula image) during illumination and emission is varied individually for both apical and endocardial stimulation protocols. Panel A plots τopt vs. δeff during illumination and emission for apical stimulation; B shows the same for endocardial stimulation.

Comment in

References

    1. Loew, L. M. 2001. Optical mapping of cardiac excitation and arrhythmias. In Mechanisms and Principles of Voltage-Sensitive Fluorescence. Futura Publishing, Armonk, NY. 33–46.
    1. Efimov, I., V. Nikolski, and G. Salama. 2004. Optical imaging of the heart (review). Circ. Res. 94:21–33. - PubMed
    1. Baxter, W., S. Mironov, A. Zaitsev, J. Jalife, and A. Pertsoz. 2001. Visualizing excitation waves inside cardiac muscle using transillumination. Biophys. J. 80:516–530. - PMC - PubMed
    1. Ding, L., R. Splinter, and S. Knisley. 2001. Quantifying spatial localization of optical mapping using Monte Carlo simulations. IEEE Trans. Biomed. Eng. 48:1098–1107. - PubMed
    1. Hyatt, C., S. Mironov, M. Wellner, O. Berenfeld, A. Popp, D. Weitz, J. Jalife, and A. Pertsov. 2003. Synthesis of voltage-sensitive fluorescence signals from three-dimensional myocardial activation patterns. Biophys. J. 85:2673–2683. - PMC - PubMed

Publication types

LinkOut - more resources