. 2006 Feb;116(2):357-68.
doi: 10.1172/JCI24521. Epub 2006 Jan 26.

Altered renal tubular expression of the complement inhibitor Crry permits complement activation after ischemia/reperfusion

Affiliations

Altered renal tubular expression of the complement inhibitor Crry permits complement activation after ischemia/reperfusion

Joshua M Thurman et al. J Clin Invest. 2006 Feb.

Abstract

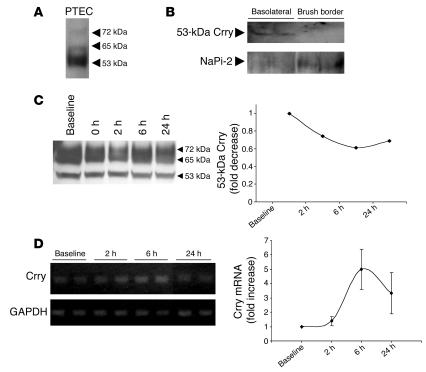
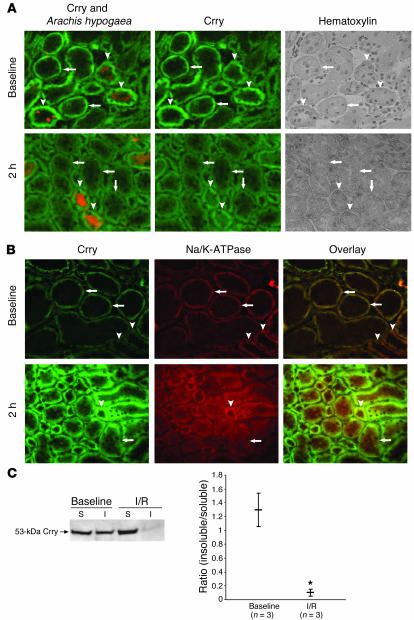
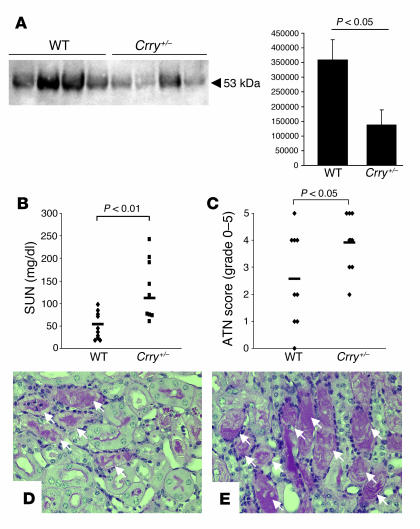
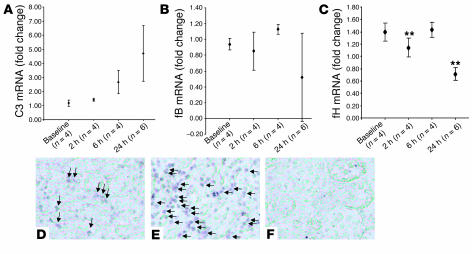
Ischemia/reperfusion (I/R) of several organs results in complement activation, but the kidney is unique in that activation after I/R occurs only via the alternative pathway. We hypothesized that selective activation of this pathway after renal I/R could occur either because of a loss of complement inhibition or from increased local synthesis of complement factors. We examined the relationship between renal complement activation after I/R and the levels and localization of intrinsic membrane complement inhibitors. We found that loss of polarity of complement receptor 1-related protein y (Crry) in the tubular epithelium preceded activation of the alternative pathway along the basolateral aspect of the tubular cells. Heterozygous gene-targeted mice that expressed lower amounts of Crry were more sensitive to ischemic injury. Furthermore, inhibition of Crry expressed by proximal tubular epithelial cells in vitro resulted in alternative pathway-mediated injury to the cells. Thus, altered expression of a complement inhibitor within the tubular epithelium appears to be a critical factor permitting activation of the alternative pathway of complement after I/R. Increased C3 mRNA and decreased factor H mRNA were also detected in the outer medulla after I/R, suggesting that altered synthesis of these factors might further contribute to complement activation in this location.


Figures

Figure 1
Figure 1
Localization of membrane-bound complement inhibitors within the mouse kidney. Three different membrane-bound complement inhibitors are located within the mouse kidney. (A) Crry is expressed in the glomeruli (arrowhead) and in tubules. (B) Crry in the renal tubules is polarized to the basolateral aspect of the tubules. Inset: Dual staining for Crry (green) and type IV collagen (red) demonstrates that expression of Crry is adjacent to the tubular basement membrane. Staining with secondary antibody alone in unmanipulated kidneys (C) and kidneys subjected to ischemia and 2 hours of reperfusion (D) demonstrate the specificity of staining with the anti-Crry antibody. (E) CD59 and (F) DAF are also expressed in glomeruli (arrowheads). In addition, these inhibitors may be expressed in the small blood vessels (arrows), but not in tubules. Original magnification, ×200 (A and CF); ×400 (B).
Figure 2
Figure 2
Immunogold localization of Crry in PTECs. Immunogold labeling of Crry in kidney sections was performed, and the labeling of PTECs (A) was examined (arrow, brush border; arrowhead, basal cell surface). Gold particles could be seen clustered along the basal aspect of the cells (B), and was present to a lesser degree in the apical brush border (C). Original magnification, ×1,200 (A), ×18,500 (B and C).
Figure 3
Figure 3
The kinetics of complement activation after I/R. (A) Complement deposition along the tubular basement membrane was assessed by immunofluorescence after ischemia and variable times of reperfusion. Staining was graded by a renal pathologist according to the percentage of tubules in the outer medulla with C3 deposited along most of the basement membrane. The extent of C3 deposition was significantly increased by 6 hours of reperfusion and peaked at 24 hours. (B) Tubular damage as assessed by light microscopy and (C) SUN peaked at 24 hours of reperfusion and had returned to baseline by 48 hours of reperfusion. Epithelial cell swelling and disruption of the brush border (arrow) were evident by 6 hours, and necrosis (arrowhead) was evident by 24 hours. (D) Western blot analysis of whole-kidney lysates demonstrates that the approximately 40-kD C3 activation fragment increased after 24 hours of reperfusion. *P < 0.05 versus baseline. n = 4 for each time point. Original magnification, ×200 (A), ×400 (B).
Figure 4
Figure 4
Crry levels in the kidney after I/R. (A) Lysates from a proximal tubular cell line demonstrate that Crry in the tubular cells is composed almost entirely of the 53-kDa isoform. (B) Protein lysates from rat kidneys enriched for basolateral membrane proteins or brush border membrane proteins demonstrated that 53-kDa Crry resides almost entirely in the basolateral fraction. In contrast, type IIa Na/Pi cotransporter (NaPi-2), which is present in the brush border, was more abundant in the brush border–enriched fraction. (C) Total kidney lysates were blotted for Crry after ischemia and variable times of reperfusion. Densitometry of 53-kDa Crry was averaged for duplicate blots and showed a trend toward decreased expression after 6 hours of reperfusion. (D) Semi-quantitative PCR of cDNA made from the outer medulla demonstrated a trend toward increased transcription of Crry after 6 hours of reperfusion.
Figure 5
Figure 5
The polarity of Crry is lost after I/R. Immunofluorescence microcopy was performed on tissue sections at baseline or after ischemia and variable times of reperfusion. (AE) Dual staining for Crry (green) and C3 (red) was performed. (A) At baseline Crry was polarized to the basolateral aspect of the tubules in the kidney and scant C3 deposition was seen. (B) After 24 minutes of ischemia, the polarity of Crry expressed by proximal tubules was lost. Crry was seen more diffusely throughout the PTEC and within the tubule lumen (arrow). After 6 (C) and 24 hours (D) of reperfusion, an increasing percentage of tubules in the outer medulla ceased to express Crry. Those tubules that no longer expressed Crry showed extensive C3 deposition along their tubular basement membranes. Dashed lines indicate the tubule lumen, demonstrating that the tubule was still lined by epithelial cells although Crry was not detectable. (E) By 48 hours of reperfusion, Crry expression and the polarity of Crry was restored to baseline. (F) Staining of urinary sediment for F-actin (red) and Crry (green) revealed that after 2 hours of reperfusion, the sediment contained cellular blebs (as evidenced by the F-actin) and Crry. Original magnification, ×400.
Figure 6
Figure 6
Complement deposition after I/R does not colocalize with Crry. (AC) Lower-powered views (original magnification, ×100) of the kidney demonstrate that the deposition of C3 during reperfusion only occurred along tubules that lost basolateral expression of Crry. Glomeruli (arrowheads) indicate cortical tissue, and the outer medulla is shown toward the bottom of each frame. (A) At baseline, Crry was heavily expressed in the glomerulus and along the basolateral aspect of the tubules. (B) After 2 hours of reperfusion, the polarity of Crry in many tubules was disrupted. (C) After 24 hours of reperfusion, most of the tubules had diminished levels of Crry. C3 was extensively deposited along the proximal tubules. Some tubules retained normal Crry expression and polarization (arrows) and showed little C3 deposition. In areas of heavy C3 deposition, little colocalization of C3 and Crry (yellow) is seen. (D and E) Histograms of Crry and C3 staining at baseline (D) and after 24 hours of reperfusion (E) further demonstrate that little colocalization occurred. Pixels are mapped according to Crry and C3 intensity. (D) The heat map shows the relative population densities depicted by color. Pixels with a high intensity of both C3 and Crry are plotted in the upper right quadrant. (E) Even after 24 hours of reperfusion, when the population of pixels with a high C3 intensity was much increased, virtually none of these high C3 pixels demonstrated concurrent high-intensity staining for Crry.
Figure 7
Figure 7
Loss of polarity in the proximal tubules after I/R. (A) Dual staining for Crry (green) and Arachis hypogaea (red, a marker of distal tubules) showed that Crry in proximal tubules had a sharp, basolateral localization (arrows), whereas expression in distal tubules (arrowheads) had a more diffuse appearance. After ischemia and 2 hours of reperfusion, the most prominent change was the loss of polarity in the proximal tubules. (B) Dual staining for Crry (green) and Na/K-ATPase (red) demonstrated that both were polarized proteins that colocalized at baseline to the basolateral aspect of proximal tubules (yellow). After ischemia and 2 hours of reperfusion the polarity of both proteins was lost, and both appeared dispersed throughout the cytoplasmic domain. (C) Protein was extracted from kidneys at baseline and after ischemia and 2 hours of reperfusion using a Triton X-100–containing lysis buffer. Fractions of triton-soluble (S) and -insoluble (I) protein were separated by SDS-PAGE and blotted for Crry. The 53-kDa form of Crry was detectable in the triton-insoluble fraction at baseline, and the ratio of triton-insoluble to -soluble Crry was greater than 1. After ischemia and 2 hours of reperfusion, over 90% of the Crry had become triton soluble. *P < 0.01 versus baseline. Original magnification, ×200.
Figure 8
Figure 8
Crry-deficient mice are more susceptible to I/R injury than wild-type controls. (A) Kidney lysates from Crry+/– mice and wild-type controls were blotted for Crry, demonstrating that the Crry+/– mice expressed approximately half the protein of wild-type controls. Crry+/– mice showed significantly greater increases in SUN (B) and morphological injury (C) compared with control mice after 20 minutes of ischemia and 24 hours of reperfusion. (D and E) Representative images from the outer stripe of the outer medulla in wild-type (D) and Crry+/– (E) mice after I/R demonstrated that tubular injury (arrows) was more extensive in the Crry+/– mice. Original magnification, ×400.
Figure 9
Figure 9
Intact Crry function is necessary to prevent injury to PTECs by alternative pathway components present in mouse serum. PTECs were incubated with fresh mouse serum in the presence or absence of 5D5, an inhibitory mAb to Crry. When incubated with 5D5, the addition of serum to the PTECs resulted in LDH release by the cells. The addition of control IgG, in contrast, did not injure the cells. The addition of the mAb 1379, a specific inhibitor for factor B of the alternative pathway, prevented the release of LDH by cells incubated with 5D5 and serum. The reactions were conducted with 10 mM EGTA to prevent activation of the classical pathway by the antibody. The experiment was repeated using IgG and Fab fragments of the 5D5 antibody, and LDH release was similar in the 2 groups.
Figure 10
Figure 10
Local synthesis of complement components within the kidney after I/R. The outer medulla was dissected out from unmanipulated kidneys and kidneys subjected to ischemia and variable times of reperfusion. mRNA was isolated from these samples, and quantitative real-time PCR was performed to assess changes in the local synthesis of the complement components C3 (A), factor B (fB, B), or factor H (fH, C) after I/R. These components were expressed at low levels within unmanipulated kidneys. A trend toward increased C3 was seen after 24 hours but did not reach statistical significance. Significant decreases in factor H synthesis were observed after 2 and 24 hours of reperfusion (**P < 0.01 versus sham treatment). (D and E) In situ hybridization for C3 demonstrated that C3 mRNA (arrows) was detectable in the outer medulla of sham-treated animals (D), but levels were much higher after ischemia and 24 hours of reperfusion (E). Hybridization of sham (not shown) and postischemic (F) kidneys with a sense probe for C3 were performed as negative controls. In situ hybridization was performed on 4 animals per group, and representative images are shown.

References

    1. Thurman JM, Ljubanovic D, Edelstein CL, Gilkeson GS, Holers VM. Lack of a functional alternative complement pathway ameliorates ischemic acute renal failure in mice. J. Immunol. 2003;170:1517–1523. - PubMed
    1. Zhou W, et al. Predominant role for C5b-9 in renal ischemia/reperfusion injury. J. Clin. Invest. 2000;105:1363–1371. - PMC - PubMed
    1. De Vries B, et al. Complement factor C5a mediates renal ischemia-reperfusion injury independent from neutrophils. J. Immunol. 2003;170:3883–3889. - PubMed
    1. Pratt JR, et al. Nontransgenic hyperexpression of a complement regulator in donor kidney modulates transplant ischemia/reperfusion damage, acute rejection, and chronic nephropathy. Am. J. Pathol. 2003;163:1457–1465. - PMC - PubMed
    1. Park P, et al. Injury in renal ischemia-reperfusion is independent from immunoglobulins and T lymphocytes. Am. J. Physiol. Renal Physiol. 2002;282:F352–F357. - PubMed

Publication types

MeSH terms