. 2006 Feb 7;103(6):1675-80.
doi: 10.1073/pnas.0506135103. Epub 2006 Jan 30.

A method for determining the dependence of calcium oscillations on inositol trisphosphate oscillations

Affiliations

A method for determining the dependence of calcium oscillations on inositol trisphosphate oscillations

J Sneyd et al. Proc Natl Acad Sci U S A. .

Abstract

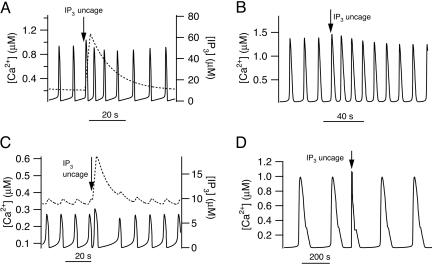
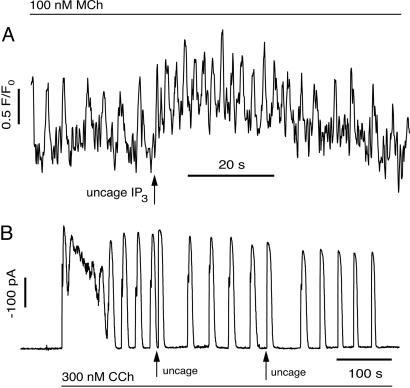
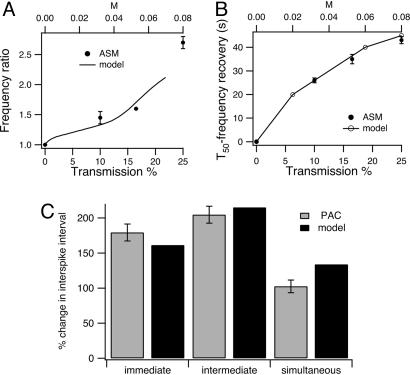
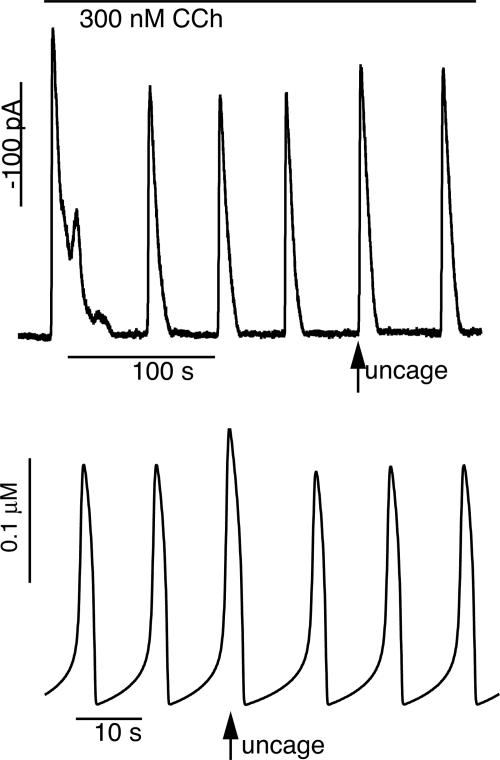
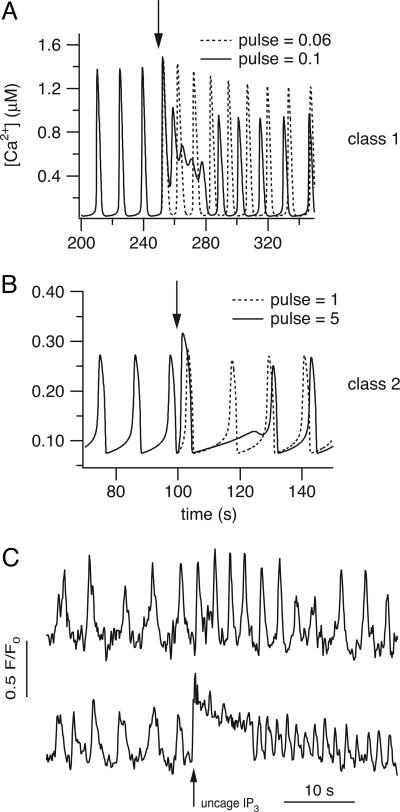
In some cell types, oscillations in the concentration of free intracellular calcium ([Ca2+]) are accompanied by oscillations in the concentration of inositol 1,4,5-trisphosphate ([IP3]). However, in most cell types it is still an open question as to whether oscillations in [IP3] are necessary for Ca2+ oscillations in vivo, or whether they merely follow passively. Using a wide range of models, we show that the response to an artificially applied pulse of IP3 can be used to distinguish between these two cases. Hence, we show that muscarinic receptor-mediated, long-period Ca2+ oscillations in pancreatic acinar cells depend on [IP3] oscillations, whereas short-period Ca2+ oscillations in airway smooth muscle do not.


Conflict of interest statement

Conflict of interest statement: No conflicts declared.

Figures

Fig. 1.
Fig. 1.
Model responses to pulses of IP3. (A and B) Responses of class 1 models to a pulse of IP3. (A) Response of the Atri model (4); pst = 10, M = 20, tpulse = 70, twidth = 3. The solid line is [Ca2+] and is plotted against the left axis; the dotted line is [IP3] and is plotted against the right axis. (B) Response of the Li–Rinzel model (6); pst = 0.8, M = 0.05, tpulse = 250, twidth = 10. (C and D) Responses of class 2 models to a pulse of IP3. These responses were calculated from the same models as A and B but modified so that Ca2+ oscillations depend on oscillations in [IP3] (details in Appendix). In each panel a pulse of IP3 was added at the arrow. (C) Response of the modified Atri model (4); ν4 = 6, M = 3, tpulse = 100, twidth = 3. (D) Response of the modified Li–Rinzel model (6); ν4 = 0.7, M = 5, tpulse = 600, twidth = 2.
Fig. 2.
Fig. 2.
Responses of ASM and PAC to pulses of IP3. (A) In ASM, photorelease of IP3 causes a transient increase in oscillation frequency. (B) In PAC, photorelease of IP3 causes a delay in the next peak of the Ca2+ oscillation.
Fig. 3.
Fig. 3.
Comparison of model and experimental results. (A and B) The dose-dependence of the changes in the oscillation frequency induced by flash photolysis of caged IP3 in ASM. The initial baseline rate of Ca2+ oscillations was induced by MCh (100 nM). The incremental increase in IP3 concentration was achieved by increasing the UV flash intensity with a series of neutral density filters with optical density (OD) values of 1.0. 0.8, and 0.6 where transmission % equals 10OD× 100. The UV exposure time was constant (100 ms) and the diameter of the area illuminated was 50 μm in all experiments. Data were obtained from different airways of two mice. The same dye and caged IP3 loading process was used for each slice. Each data point is the average of responses from four different cells. (A) Solid symbols: the ratio of the average frequency of Ca2+ oscillations during the first 20 s after the UV exposure to the preexposed frequency (30 s) induced by MCh was plotted with respect to the flash intensity (UV transmission percentage). Smooth curve: frequency increase in the class 1 Li–Rinzel model (pst = 0.6), plotted against the pulse strength (the upper axis). Calculations were performed by using the bifurcation tracking program auto, as incorporated into xppaut (29), using M as the principal bifurcation parameter. The relationship between M and transmission percentage is arbitrary but the same in A and B. (B) Time taken (T50) for the oscillation frequency to return to 50% of the average frequency increase achieved during the first 20 s after UV exposure. The open symbols are from the class 1 Li–Rinzel model (pst = 0.6) and are plotted against the upper axis. The model results are estimated at three different values of M. (C) Percent change in interspike interval in PAC for three approximate timings of the IP3 pulse. Immediate, IP3 pulse occurs right after a Ca2+ spike; intermediate, IP3 pulse occurs between two Ca2+ spikes, but not close to either one; simultaneous, IP3 pulse occurs at the same time as a Ca2+ spike would have occurred, judging by the previous oscillations. The model results are from the class 2 Atri model.
Fig. 4.
Fig. 4.
Response of PAC (Upper) and the class 2 Atri model (Lower) to a pulse of IP3 that occurs right on a Ca2+ spike. In both the experiment and the model the IP3 pulse causes a Ca2+ spike of slightly greater amplitude, with little change in subsequent spike frequency (see Fig. 3C).
Fig. 5.
Fig. 5.
Model and experimental responses to IP3 pulses of increasing magnitude. (A) In class 1 models, an increase in the strength of the IP3 pulse causes oscillations of greater frequency and smaller amplitude, superimposed on a raised baseline. If the pulse is large enough, the oscillations can disappear entirely, leaving only the raised baseline (traces calculated from the Li–Rinzel model). (B) In class 2 models, an increase in the strength of the IP3 flash leads to a greater phase delay (traces calculated from the Atri model). (C) In ASM, an increase in the strength of the IP3 pulse leads to fast oscillations superimposed on a raised baseline, as in class 1 models. C Upper was with a smaller light flash, and thus a smaller IP3 release than in C Lower. The responses of all four cells (from two different animals) were qualitatively similar.

References

    1. Berridge M. J., Bootman M. D., Roderick H. L. Nat. Rev. Mol. Cell Biol. 2003;4:517–529. - PubMed
    1. Berridge M. J., Galione A. FASEB J. 1988;2:3074–3082. - PubMed
    1. Tsien R.W., Tsien R.Y. Annu. Rev. Cell Biol. 1990;6:715–760. - PubMed
    1. Atri A., Amundson J., Clapham D., Sneyd J. Biophys. J. 1993;65:1727–1739. - PMC - PubMed
    1. De Young G. W., Keizer J. Proc. Natl. Acad. Sci. USA. 1992;89:9895–9899. - PMC - PubMed

Publication types