. 2006 Feb 7;103(6):1970-5.
doi: 10.1073/pnas.0508491103. Epub 2006 Jan 30.

Odorant responses of olfactory sensory neurons expressing the odorant receptor MOR23: a patch clamp analysis in gene-targeted mice

Affiliations

Odorant responses of olfactory sensory neurons expressing the odorant receptor MOR23: a patch clamp analysis in gene-targeted mice

Xavier Grosmaitre et al. Proc Natl Acad Sci U S A. .

Abstract

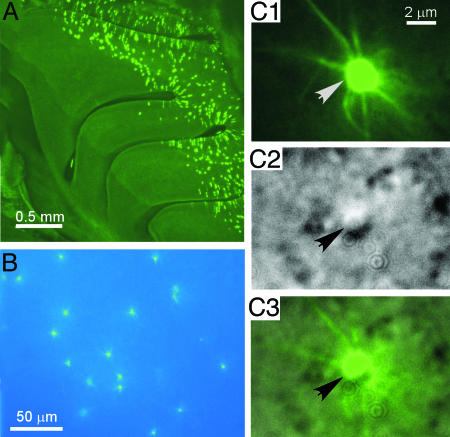
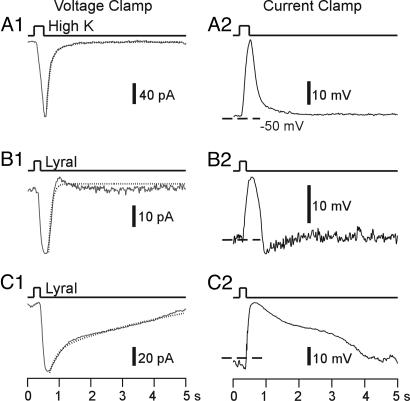
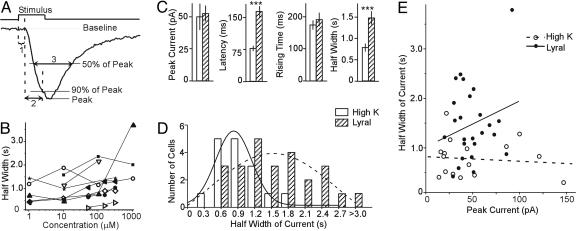
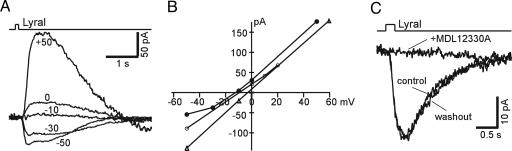
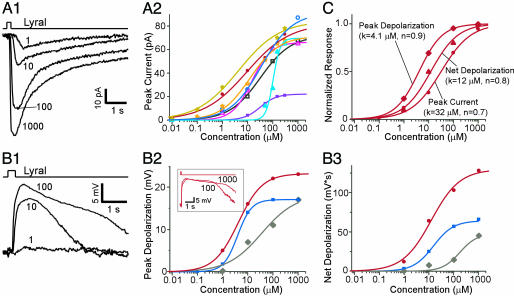
A glomerulus in the mammalian olfactory bulb receives axonal inputs from olfactory sensory neurons (OSNs) that express the same odorant receptor (OR). Glomeruli are generally thought to represent functional units of olfactory coding, but there are no data on the electrophysiological properties of OSNs that express the same endogenous OR. Here, using patch clamp recordings in an intact epithelial preparation, we directly measured the transduction currents and receptor potentials from the dendritic knobs of mouse OSNs that express the odorant receptor MOR23 along with the green fluorescent protein. All of the 53 cells examined responded to lyral, a known ligand for MOR23. There were profound differences in response kinetics, particularly in the deactivation phase. The cells were very sensitive to lyral, with some cells responding to as little as 10 nM. The dynamic range was unexpectedly broad, with threshold and saturation in individual cells often covering three log units of lyral concentration. The potential causes and biological significance of this cellular heterogeneity are discussed. Patch clamp recording from OSNs that express a defined OR provides a powerful approach to investigate the sensory inputs to individual glomeruli.


Conflict of interest statement

Conflict of interest statement: No conflicts declared.

Figures

Fig. 1.
Fig. 1.
Visualization of MOR23 cells under fluorescence illumination and DIC microscopy. (A) Whole-mount view of the nasal turbinates in a MOR23-IRES-tauGFP mouse under fluorescence illumination. (B) Visualization of the GFP+ (MOR23) cells in the intact, nondissociated olfactory epithelium under fluorescence illumination. (C) Identification of the MOR23 cells under DIC microscopy. The same field was taken under fluorescence illumination (C1) or DIC (C2). C3 shows an overlay of C1 and C2. The arrows (in the same position in all three images) point to the knob of a MOR23 cell.
Fig. 2.
Fig. 2.
MOR23 cells show heterogeneous response kinetics to lyral. Inward currents under the voltage clamp mode (A1, B1, and C1) or depolarizing membrane potentials under the current clamp mode (A2, B2, and C2) were induced by high-K+ (A) or 300 μM lyral (B and C). The recordings from AC were from three different cells. The holding potential was −50 mV under voltage clamp (A1, B1, and C1), and dashed lines indicate −50 mV under current clamp (A2, B2, and C2). The dotted lines in A1, B1, and C1 are fitted double-exponential curves.
Fig. 3.
Fig. 3.
Summary of lyral-induced responses in MOR23 cells. (A) Definition of the four parameters. The peak current is measured from the baseline to the peak. The response latency (1) is the time between the onset of the stimulus and the starting point of the response. The 0–90% rising time (2) is the time it takes for the current to reach 90% of the peak from the starting point of the response. The half-width of the current (3) is the time between the rising and falling phase at 50% of the peak. (B) The half-width of the transduction current is plotted against lyral concentration. The data were from nine cells with the holding potential of –50 mV. (C) Comparison between high-K+ (n = 16) and lyral-induced responses (n = 25) in MOR23 cells. Data are shown in mean ± SE. Significant difference (P < 0.001, t test) is marked by ∗∗∗. (D) Histogram of the distribution of the half-width of the currents induced by high K+ and lyral, fitted by the Gaussian distributions. (E) The half-width of the induced current is plotted against the peak. The straight lines are linear regression fittings. Note that there is no correlation between the peak and the half-width.
Fig. 4.
Fig. 4.
Properties of lyral-induced responses in MOR23 cells. (A and B) The reversal potential of lyral-induced responses in the intact epithelium. (A) Lyral (10 μM) induced responses from a MOR23 cell at different holding potentials, indicated by the number next to each trace. The steady-state currents were subtracted. (B) The peak current is plotted against the holding potential for three different cells. (C) Lyral-induced responses were reversibly blocked by MDL12330A. The MOR23 cell was stimulated by 300 μM lyral, and the holding potential was −50 mV.
Fig. 5.
Fig. 5.
Dose–response relationships of MOR23 cells in responding to lyral. (A1) The inward currents induced by lyral at different concentrations (indicated by the numbers in μM) under voltage clamp. The holding potential was −60 mV. (A2) The dose–response curves of the peak currents from eight cells fitted with Hill equations. (B1) Depolarization induced by lyral at different concentrations from another cell under current clamp. The resting potential was approximately −52 mV. (B2 and B3) The dose–response curves of the peak depolarization (B2) or the net depolarization (B3) from three cells. (B2 Inset) The receptor potentials elicited by lyral at 100 and 1,000 μM in one cell (red) are shown. (C) The normalized three dose–response curves from the same cell. They are shown in filled circles in A and B (red). K represents the concentration when half of the maximum response was reached, and n is the Hill coefficient.

Similar articles

Cited by

References

    1. Buck L., Axel R. Cell. 1991;65:175–187. - PubMed
    1. Young J. M., Shykind B. M., Lane R. P., Tonnes-Priddy L., Ross J. A., Walker M., Williams E. M., Trask B. J. Genome Biol. 2003;4:R71. - PMC - PubMed
    1. Zhang X., Rogers M., Tian H., Zou D.-J., Liu J., Ma M., Shepherd G. M., Firestein S. J. Proc. Natl. Acad. Sci. USA. 2004;101:14168–14173. - PMC - PubMed
    1. Ressler K. J., Sullivan S. L., Buck L. B. Cell. 1994;79:1245–1255. - PubMed
    1. Vassar R., Chao S. K., Sitcheran R., Nunez J. M., Vosshall L. B., Axel R. Cell. 1994;79:981–991. - PubMed

Publication types