. 2006 Feb;127(2):145-58.
doi: 10.1085/jgp.200509439.

Identification of a disulfide bridge linking the fourth and the seventh extracellular loops of the Na+/glucose cotransporter

Affiliations

Identification of a disulfide bridge linking the fourth and the seventh extracellular loops of the Na+/glucose cotransporter

Dominique G Gagnon et al. J Gen Physiol. 2006 Feb.

Abstract

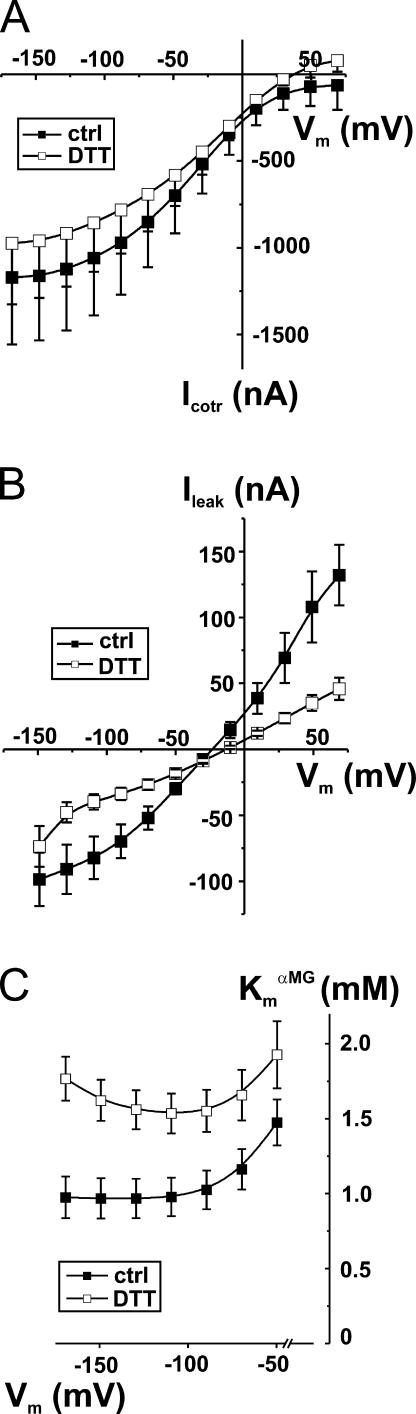
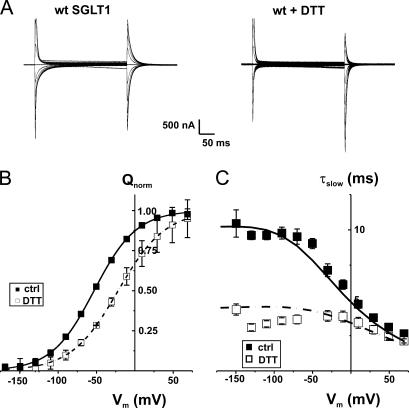
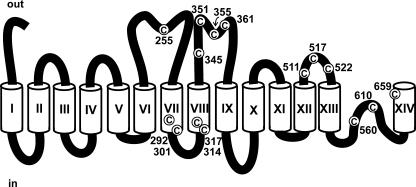
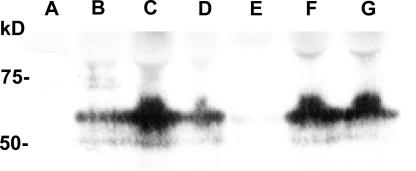
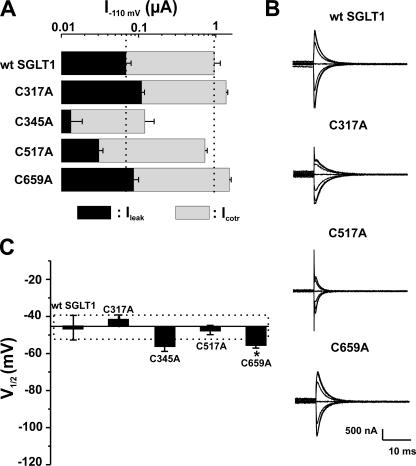
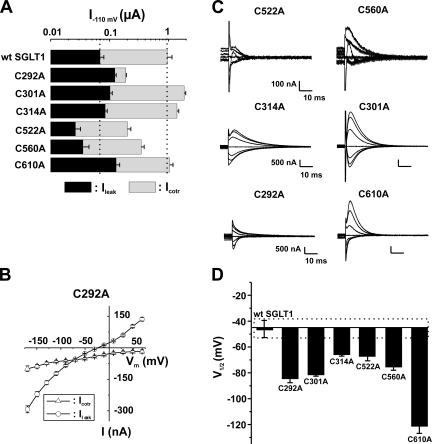
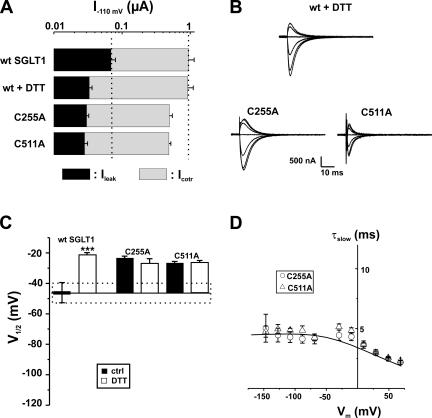
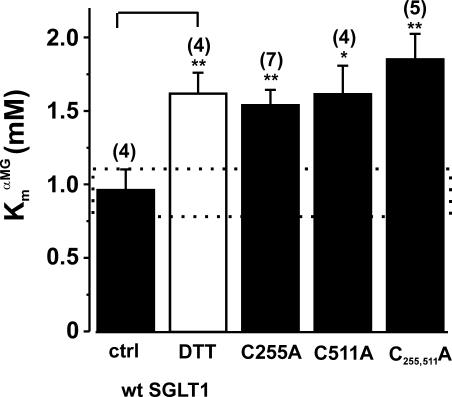
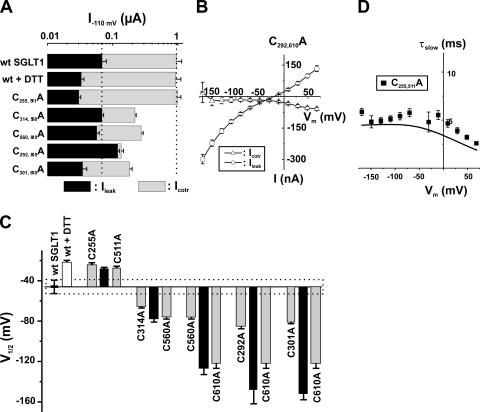
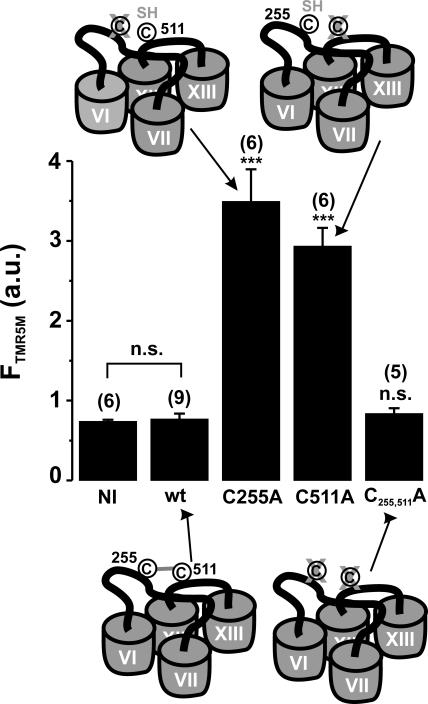
The Na+/glucose cotransporter (SGLT1) is an archetype for the SLC5 family, which is comprised of Na+-coupled transporters for sugars, myo-inositol, choline, and organic anions. Application of the reducing agent dithriothreitol (DTT, 10 mM) to oocytes expressing human SGLT1 affects the protein's presteady-state currents. Integration of these currents at different membrane potentials (Vm) produces a Q-V curve, whose form was shifted by +25 mV due to DTT. The role of the 15 endogenous cysteine residues was investigated by expressing SGLT1 constructs, each bearing a single mutation for an individual cysteine, in Xenopus oocytes, using two-microelectrode voltage-clamp electrophysiology and fluorescent labeling. 12 of the 15 mutants were functional and could be separated into three distinct groups based on the effect of the mutation on the Q-V curve: four mutants did not perturb the transferred charge, six mutants shifted the Q-V curve towards negative potentials, and two mutants (C255A and C511A) produced a shift in the positive direction that was identical to the shift produced by DTT on the wild-type (wt) SGLT1. The double mutant C(255,511)A confirms that the effects of each single mutant on the Q-V curve were not additive. With respect to wt SGLT1, the apparent affinities for alpha-methylglucose (alphaMG) were increased in a similar manner for the single mutants C255A and C511A, the double mutant C(255,511)A as well as for wt SGLT1 treated with DTT. When exposed to a maleimide-based fluorescent probe, wt SGLT1 was not significantly labeled but mutants C255A and C511A could be clearly labeled, indicating an accessible cysteine residue. These residues are presumed to be C511 and C255, respectively, as the double mutant C(255,511)A could not be labeled. These results strongly support the hypothesis that C255 and C511 form a disulfide bridge in human SGLT1 and that this disulfide bridge is involved in the conformational change of the free carrier.


Figures

Figure 1.
Figure 1.
Effects of DTT exposure on steady-state parameters of wt Na+/glucose cotransporter (wt SGLT1). (A) Effect of DTT on αMG cotransport current (Icotr) of wt SGLT1. Estimation of the currents was done under control conditions (filled symbols) and in the presence of DTT (2.5 mM) (open symbols) on each oocyte (n = 3, paired experiments). (B) Effect of DTT on Na+ leak current (Ileak) of wt SGLT1. A 30-min exposure with 10 mM DTT was done before the experimental test of Ileak (done in the presence of DTT) (n = 6 for control conditions, filled symbols, n = 5 for DTT, open symbols, unpaired experiments). (C) Effect of DTT on apparent affinity for αMG (Km α MG) as a function of membrane potential (Vm). Estimation of the apparent affinity for αMG was done under control conditions (filled symbols) and in the presence of DTT (2.5 mM) (open symbols) on each oocyte (n = 4, paired experiments).
Figure 2.
Figure 2.
Effect of DTT exposure on presteady-state parameters of wt Na+/glucose cotransporter (wt SGLT1). (A) Presteady-state currents (Pz-sensitive currents in the absence of glucose) of a typical oocyte expressing wt SGLT1 under control conditions and after exposure to DTT (30 min preincubation with 10 mM DTT, with DTT present in subsequent experimental solutions). (B) Effect of DTT on transferred charges (Q-V curve) of wt SGLT1. Q-V curves were fitted with a Boltzmann equation (see MATERIALS AND METHODS), adjusted to 0 at hyperpolarizing voltages and normalized with respect to the extrapolated Qmax (n = 9 for control conditions, filled symbols, n = 6 for DTT, open symbols, unpaired experiments). (C) Time constant of the 10-ms component of presteady-state currents of wt SGLT1 compared with wt + DTT. The curves represent the time constants evaluated with a four-state model of presteady-state currents with parameters described in Table I.
Figure 3.
Figure 3.
A modified topological model of SGLT1. Transmembrane segments are identified by Roman numerals, amino acid positions of endogenous cysteine residues, depicted in white circles, are indicated and the extracellular and intracellular side are indicated by the words “out” and “in,” respectively.
Figure 4.
Figure 4.
Western blot analysis of some selected mutants, compared with wt SGLT1, detected with an anti-myc antibody. Extracts enriched in plasma membrane were purified from noninjected oocytes (A), wt SGLT1–injected oocytes (B), and mutants C345A (C), C351A (D), C355A (E), and C361A (F) and double mutant C522,560A (G) and were loaded onto a polyacrylamide gel (equivalent to membranes from 20 oocytes), and protein equivalencies were confirmed by Ponceau Red staining. Molecular standard masses are indicated on the left (in kD) (New England Biolabs).
Figure 5.
Figure 5.
Electrophysiological characteristics of mutants classified in Group A, as compared with wt SGLT1. (A) Comparison of mutant SGLTs activities to that of wt SGLT1. Maximal αMG cotransport (Icotr at 5 mM αMG) and Na+ leak (Ileak) currents were measured at −110 mV. The dotted lines indicate the mean expression level of wt SGLT1. n ≥ 5 for each mutant. (B) Off response of presteady-state currents (Pz-sensitive currents in the absence of glucose) of typical oocytes expressing each of the mutant SGLT1s compared with an oocyte expressing wt SGLT1. (C) V1/2 of mutant SGLT1s as compared with that of wt SGLT1. A dotted box represents the interval for which V1/2 of a mutant would not be significantly different from that of wt SGLT1. Errors are SEM. Asterisks indicate the statistical significance with respect to wt SGLT1 (*, P ≤ 0.05; **, P ≤ 0.01; ***, P ≤ 0.001).
Figure 6.
Figure 6.
Electrophysiological characteristics of mutants classified in Group B, as compared with wt SGLT1. (A) Comparison of mutant SGLT1 activities to that of wt SGLT1. Maximal αMG cotransport (Icotr at 5 mM αMG) and Na+ leak (Ileak) currents were measured at −110 mV. The dotted lines indicate the mean expression level of wt SGLT1. n ≥ 5 for each mutant. (B) I-V curve for αMG cotransport and Na+ leak currents of C292A. (C) Off response of presteady-state currents (Pz-sensitive currents in the absence of glucose) of typical oocytes expressing each of the mutant SGLT1s. (D) V1/2 of mutant SGLT1s as compared with that of wt SGLT1. A dotted box represents the interval for which V1/2 of a mutant would not be significantly different from that of wt SGLT1. Errors are SEM. All V1/2 values for this series of mutants were significantly different (P < 0.001 in each case) from the V1/2 of wt SGLT1.
Figure 7.
Figure 7.
Electrophysiological characteristics of mutants classified in Group C, as compared with wt SGLT1, with and without DTT. (A) Comparison of mutant SGLT1s activities to that of wt SGLT1 and to wt SGLT1 + DTT. Maximal αMG cotransport (Icotr at 5 mM αMG) and Na+ leak (Ileak) currents were measured at −110 mV. The dotted lines indicate the mean expression level of wt SGLT1. n ≥ 5 for each mutant. (B) Off response of presteady-state currents (Pz-sensitive currents in the absence of glucose) of typical oocytes expressing wt SGLT1 exposed to DTT and mutants C255A and C511A. (C) V1/2 of mutant SGLT1s as compared with that of wt SGLT1 (filled bars) and to wt SGLT1 and mutants exposed to DTT (open bars). The dotted box represents the interval for which V1/2 of a mutant would not be significantly different from that of wt SGLT1. (D) Time constants of the slow component of presteady-state currents for mutants of Group C. The curves represent the time constants evaluated with a four-state model of presteady-state currents with parameters described in Table I. Errors are SEM.
Figure 8.
Figure 8.
Apparent affinity for αMG (Km α MG) for oocytes expressing mutants C255A, C511A, and C255,511A compared with wt SGLT1, with and without DTT. The application of DTT to wt SGLT1 was performed as described in MATERIALS AND METHODS (paired experiments). The affinity was assessed with data measured at −150 mV. The dotted box represents the interval for which the Km α MG of a mutant would not be significantly different from that of wt SGLT1. The number of individual oocytes used per value is indicated in parentheses. Errors are SEM. Stars indicate the statistical significance (see Fig 5 legend).
Figure 9.
Figure 9.
Electrophysiological characteristics of the double mutants as compared with wt SGLT1. (A) Comparison of mutant SGLT1 activities to that of wt SGLT1. Maximal αMG cotransport (Icotr at 5 mM αMG) and Na+ leak (Ileak) currents were measured at −110 mV. The dotted lines indicate the mean expression level of wt SGLT1. n ≥ 5 for each mutant. (B) I-V curve for αMG cotransport and Na+ leak currents of the double mutant C292,610A. (C) V1/2 of double mutant SGLTs as compared with that of wt SGLT1 and to single mutants. Each double mutant bar (black) is preceded and followed by the two bars representing the V1/2 values for the corresponding single mutants (light gray). The dotted box represents the interval for which V1/2 of a mutant would not be significantly different from that of wt SGLT1. (D) Time constants of the slow component of presteady-state currents for the double mutant C255,511A (see Fig 7). (n = 5). The curve represents the time constants evaluated with a four-state model of presteady-state currents with parameters described in Table I. Errors are SEM.
Figure 10.
Figure 10.
Fluorescent labeling of oocytes expressing mutants C255A, C511A, and C255,511A as compared with wt SGLT1. See MATERIALS AND METHODS for the procedure of fluorescent labeling with the TMR5M fluorescent probe. The fluorescence signal is indicated in arbitrary units (a.u.). NI indicates noninjected oocytes. The number of oocytes used per sample is indicated in parentheses. A cartoon shows the availability of cysteine residues in each situation. Stars indicate the statistical significance for unpaired Student's t test against wt SGLT1 data (see Fig 5 legend). Errors are SEM.
Figure 11.
Figure 11.
Kinetic model of the Na+/glucose cotransporter states for the estimation of presteady-state currents. The model was previously described in Chen et al. (1996). See Appendices A and B for details.

Similar articles

Cited by

References

    1. Bissonnette, P., J. Noel, M.J. Coady, and J.Y. Lapointe. 1999. Functional expression of tagged human Na+-glucose cotransporter in Xenopus laevis oocytes. J. Physiol. 520(Pt 2):359–371. - PMC - PubMed
    1. Chen, J.G., S. Liu-Chen, and G. Rudnick. 1997. External cysteine residues in the serotonin transporter. Biochemistry. 36:1479–1486. - PubMed
    1. Chen, X.Z., M.J. Coady, F. Jackson, A. Berteloot, and J.Y. Lapointe. 1995. Thermodynamic determination of the Na+: glucose coupling ratio for the human SGLT1 cotransporter. Biophys. J. 69:2405–2414. - PMC - PubMed
    1. Chen, X.Z., M.J. Coady, and J.Y. Lapointe. 1996. Fast voltage clamp discloses a new component of presteady-state currents from the Na+-glucose cotransporter. Biophys. J. 71:2544–2552. - PMC - PubMed
    1. Chen, X.Z., M.J. Coady, F. Jalal, B. Wallendorff, and J.Y. Lapointe. 1997. Sodium leak pathway and substrate binding order in the Na+-glucose cotransporter. Biophys. J. 73:2503–2510. - PMC - PubMed

Publication types

MeSH terms