

Effects of filtering by Present call on analysis of microarray experiments
- PMID: 16448562
- PMCID: PMC1409797
- DOI: 10.1186/1471-2105-7-49
Effects of filtering by Present call on analysis of microarray experiments
Abstract
Background: Affymetrix GeneChips are widely used for expression profiling of tens of thousands of genes. The large number of comparisons can lead to false positives. Various methods have been used to reduce false positives, but they have rarely been compared or quantitatively evaluated. Here we describe and evaluate a simple method that uses the detection (Present/Absent) call generated by the Affymetrix microarray suite version 5 software (MAS5) to remove data that is not reliably detected before further analysis, and compare this with filtering by expression level. We explore the effects of various thresholds for removing data in experiments of different size (from 3 to 10 arrays per treatment), as well as their relative power to detect significant differences in expression.
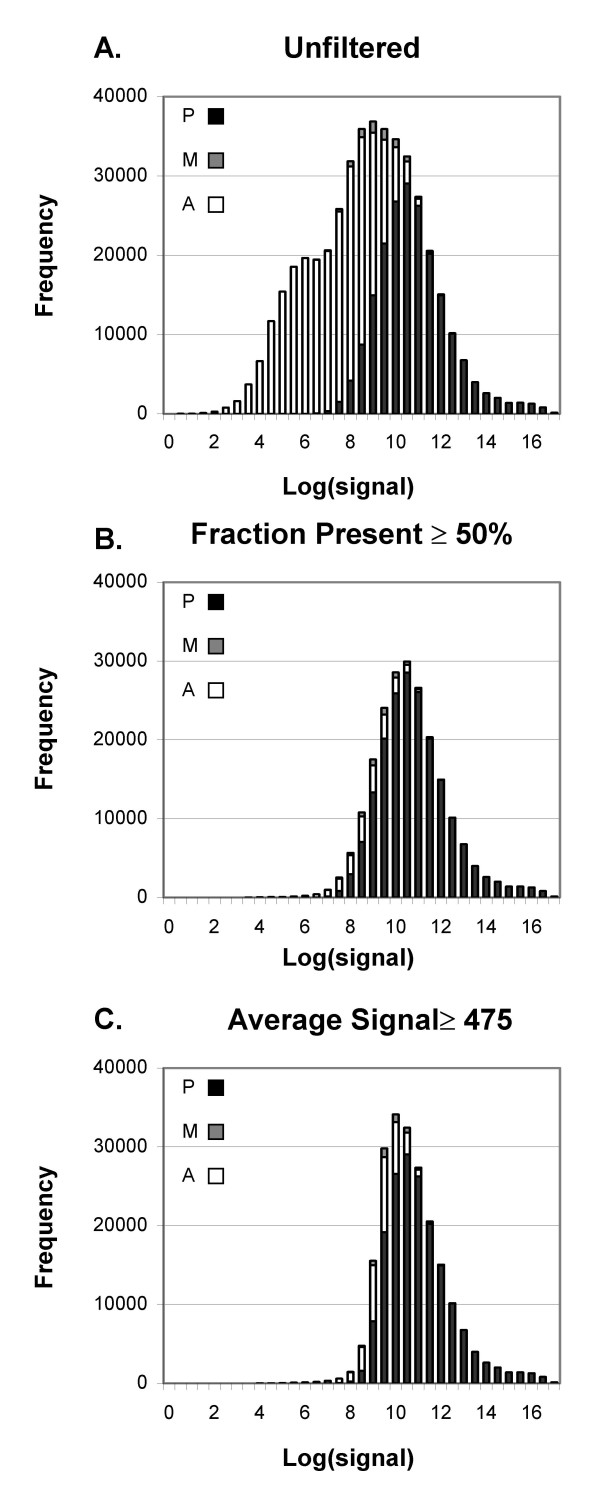
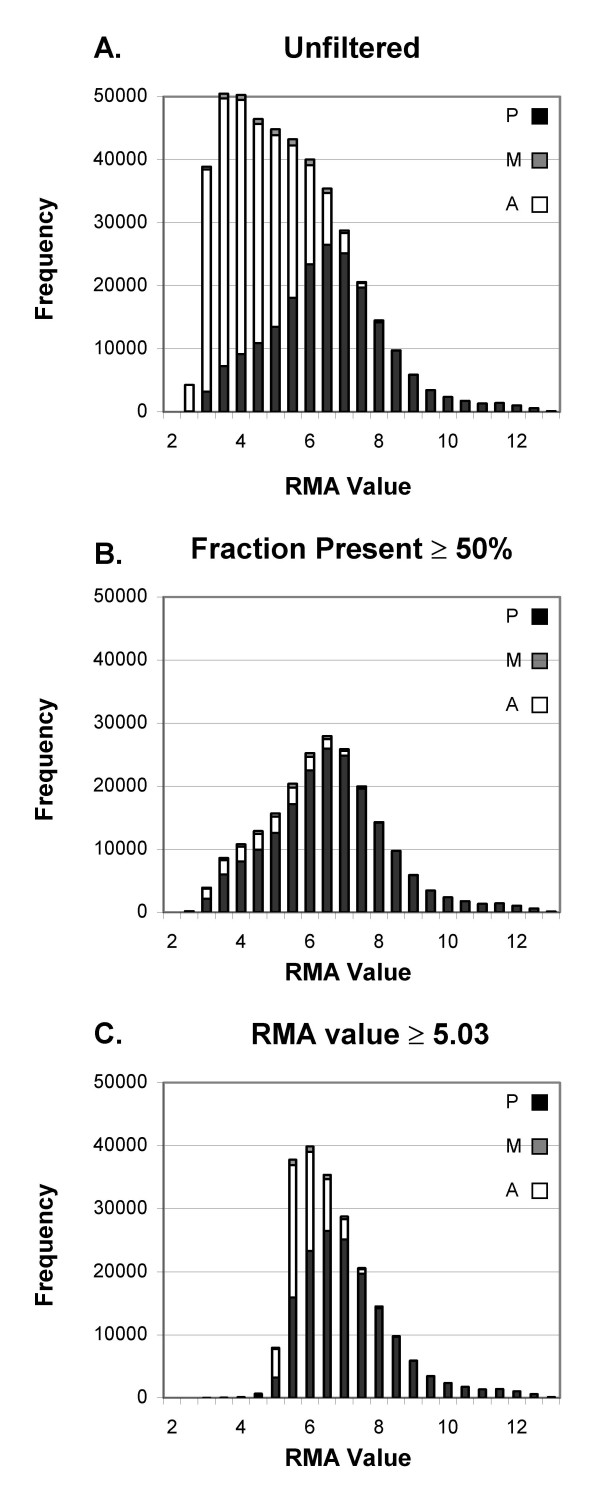
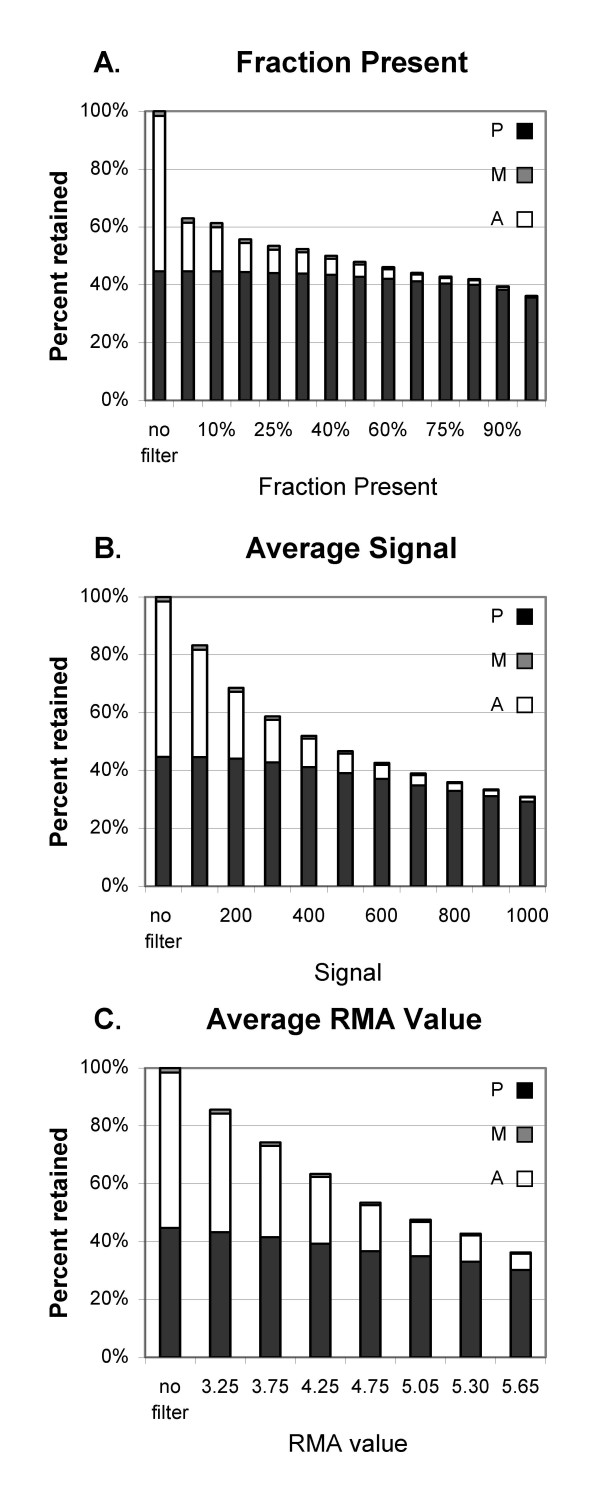
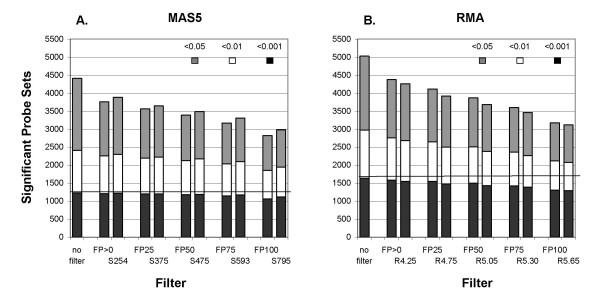
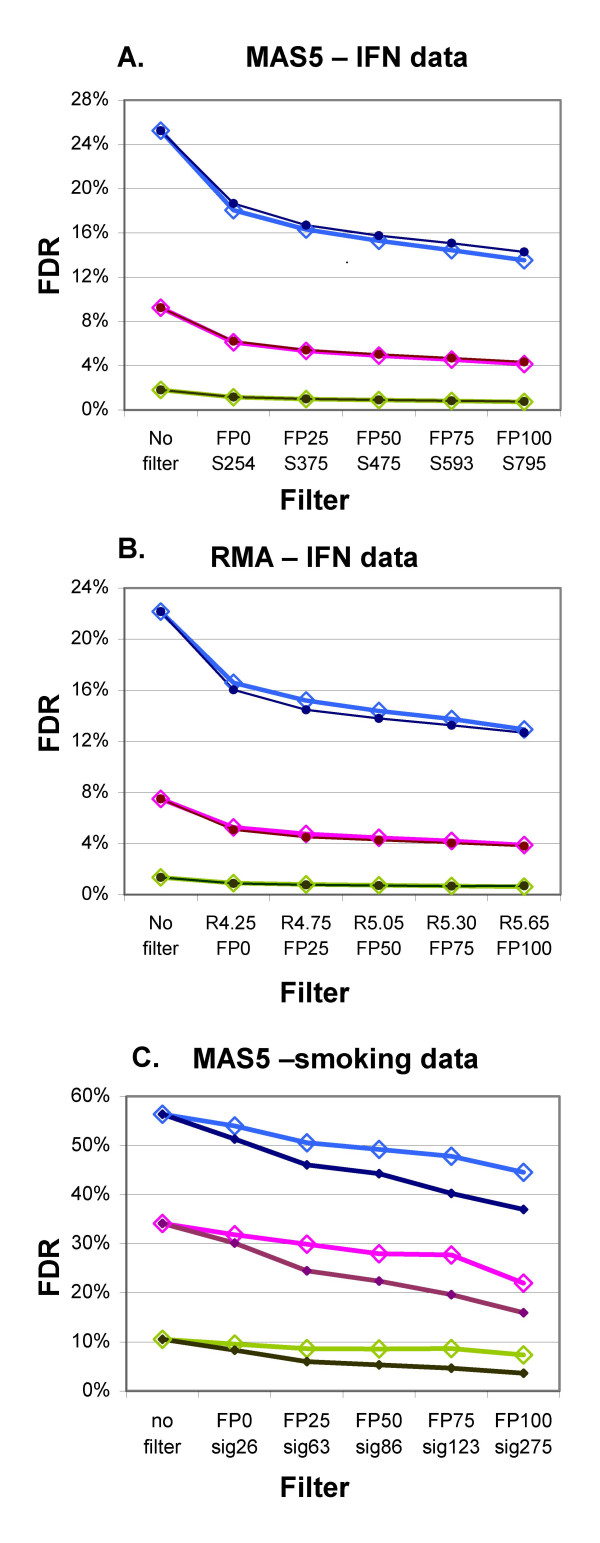
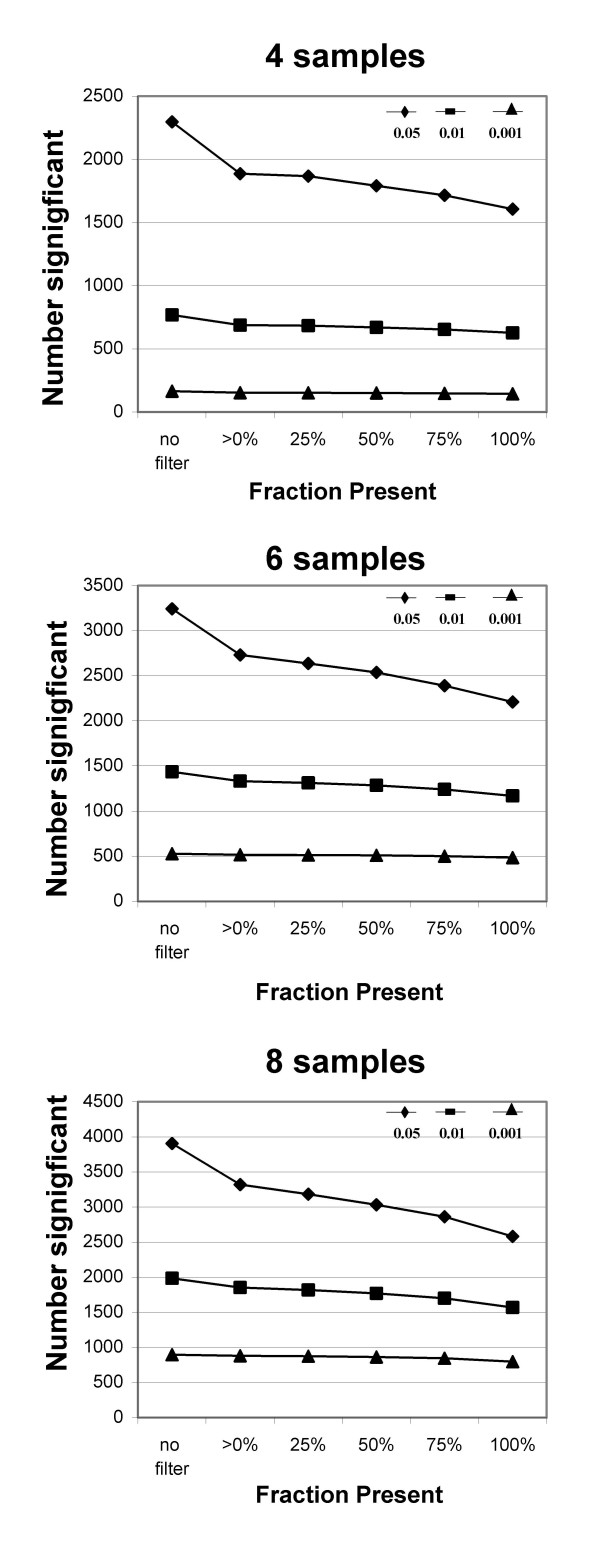
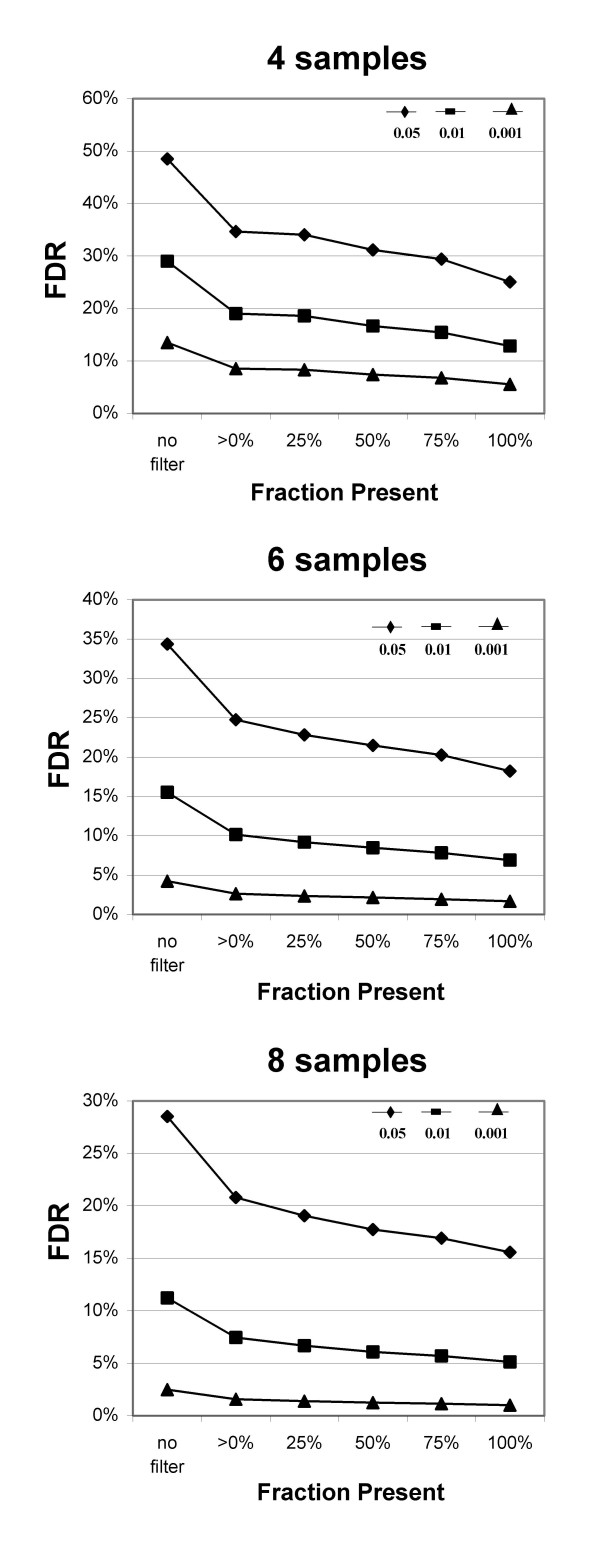
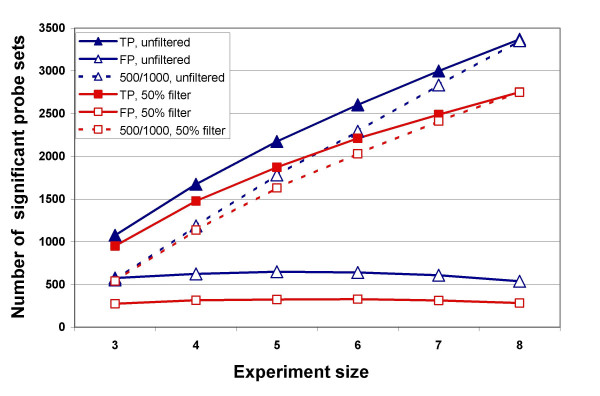
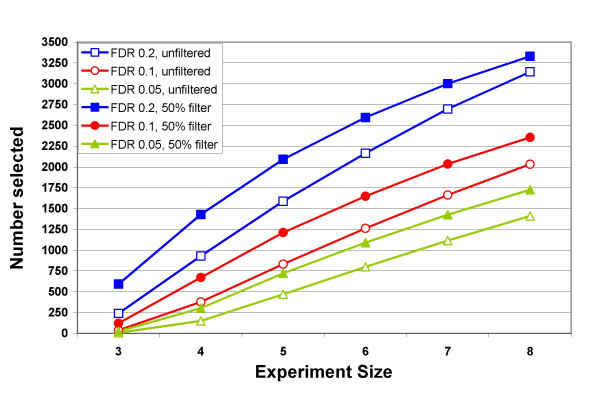
Results: Our approach sets a threshold for the fraction of arrays called Present in at least one treatment group. This method removes a large percentage of probe sets called Absent before carrying out the comparisons, while retaining most of the probe sets called Present. It preferentially retains the more significant probe sets (p < or = 0.001) and those probe sets that are turned on or off, and improves the false discovery rate. Permutations to estimate false positives indicate that probe sets removed by the filter contribute a disproportionate number of false positives. Filtering by fraction Present is effective when applied to data generated either by the MAS5 algorithm or by other probe-level algorithms, for example RMA (robust multichip average). Experiment size greatly affects the ability to reproducibly detect significant differences, and also impacts the effect of filtering; smaller experiments (3-5 samples per treatment group) benefit from more restrictive filtering (> or =50% Present).
Conclusion: Use of a threshold fraction of Present detection calls (derived by MAS5) provided a simple method that effectively eliminated from analysis probe sets that are unlikely to be reliable while preserving the most significant probe sets and those turned on or off; it thereby increased the ratio of true positives to false positives.
Figures
Similar articles
-
Filtering for increased power for microarray data analysis.BMC Bioinformatics. 2009 Jan 8;10:11. doi: 10.1186/1471-2105-10-11. BMC Bioinformatics. 2009. PMID: 19133141 Free PMC article.
-
Statistical analysis of high-density oligonucleotide arrays: a multiplicative noise model.Bioinformatics. 2002 Dec;18(12):1633-40. doi: 10.1093/bioinformatics/18.12.1633. Bioinformatics. 2002. PMID: 12490448
-
Filtering genes to improve sensitivity in oligonucleotide microarray data analysis.Nucleic Acids Res. 2007;35(16):e102. doi: 10.1093/nar/gkm537. Epub 2007 Aug 15. Nucleic Acids Res. 2007. PMID: 17702762 Free PMC article.
-
Detection call algorithms for high-throughput gene expression microarray data.Brief Bioinform. 2010 Mar;11(2):244-52. doi: 10.1093/bib/bbp055. Epub 2009 Nov 25. Brief Bioinform. 2010. PMID: 19939941 Free PMC article. Review.
-
The analysis of microarray data.Pharmacogenomics. 2003 Jul;4(4):477-97. doi: 10.1517/phgs.4.4.477.22744. Pharmacogenomics. 2003. PMID: 12831325 Review.
Cited by
-
Adaptive filtering of microarray gene expression data based on Gaussian mixture decomposition.BMC Bioinformatics. 2013 Mar 20;14:101. doi: 10.1186/1471-2105-14-101. BMC Bioinformatics. 2013. PMID: 23510016 Free PMC article.
-
Filtering, FDR and power.BMC Bioinformatics. 2010 Sep 7;11:450. doi: 10.1186/1471-2105-11-450. BMC Bioinformatics. 2010. PMID: 20822518 Free PMC article.
-
A new method for class prediction based on signed-rank algorithms applied to Affymetrix microarray experiments.BMC Bioinformatics. 2008 Jan 11;9:16. doi: 10.1186/1471-2105-9-16. BMC Bioinformatics. 2008. PMID: 18190711 Free PMC article.
-
Transcriptome sequencing of the Microarray Quality Control (MAQC) RNA reference samples using next generation sequencing.BMC Genomics. 2009 Jun 12;10:264. doi: 10.1186/1471-2164-10-264. BMC Genomics. 2009. PMID: 19523228 Free PMC article.
-
Stress-response pathways are altered in the hippocampus of chronic alcoholics.Alcohol. 2013 Nov;47(7):505-15. doi: 10.1016/j.alcohol.2013.07.002. Epub 2013 Aug 24. Alcohol. 2013. PMID: 23981442 Free PMC article.
References
-
- Benjamini Y, Hochberg Y. Controlling the false discovery rate: A practical and powerful approach to multiple testing. J R Stat Soc B. 1995;57:289–300.
-
- Jongeneel CV, Iseli C, Stevenson BJ, Riggins GJ, Lal A, Mackay A, Harris RA, O'Hare MJ, Neville AM, Simpson AJ, Strausberg RL. Comprehensive sampling of gene expression in human cell lines with massively parallel signature sequencing. Proc Natl Acad Sci U S A. 2003;100:4702–4705. doi: 10.1073/pnas.0831040100. - DOI - PMC - PubMed
Publication types
MeSH terms
LinkOut - more resources
Full Text Sources
Other Literature Sources
Miscellaneous
