Comparative Study
. 2006 Jan 31:7:18.
doi: 10.1186/1471-2164-7-18.

Comprehensive comparative analysis of kinesins in photosynthetic eukaryotes

Affiliations
Comparative Study

Comprehensive comparative analysis of kinesins in photosynthetic eukaryotes

Dale N Richardson et al. BMC Genomics. .

Abstract

Background: Kinesins, a superfamily of molecular motors, use microtubules as tracks and transport diverse cellular cargoes. All kinesins contain a highly conserved approximately 350 amino acid motor domain. Previous analysis of the completed genome sequence of one flowering plant (Arabidopsis) has resulted in identification of 61 kinesins. The recent completion of genome sequencing of several photosynthetic and non-photosynthetic eukaryotes that belong to divergent lineages offers a unique opportunity to conduct a comprehensive comparative analysis of kinesins in plant and non-plant systems and infer their evolutionary relationships.

Results: We used the kinesin motor domain to identify kinesins in the completed genome sequences of 19 species, including 13 newly sequenced genomes. Among the newly analyzed genomes, six represent photosynthetic eukaryotes. A total of 529 kinesins was used to perform comprehensive analysis of kinesins and to construct gene trees using the Bayesian and parsimony approaches. The previously recognized 14 families of kinesins are resolved as distinct lineages in our inferred gene tree. At least three of the 14 kinesin families are not represented in flowering plants. Chlamydomonas, a green alga that is part of the lineage that includes land plants, has at least nine of the 14 known kinesin families. Seven of ten families present in flowering plants are represented in Chlamydomonas, indicating that these families were retained in both the flowering-plant and green algae lineages.

Conclusion: The increase in the number of kinesins in flowering plants is due to vast expansion of the Kinesin-14 and Kinesin-7 families. The Kinesin-14 family, which typically contains a C-terminal motor, has many plant kinesins that have the motor domain at the N terminus, in the middle, or the C terminus. Several domains in kinesins are present exclusively either in plant or animal lineages. Addition of novel domains to kinesins in lineage-specific groups contributed to the functional diversification of kinesins. Results from our gene-tree analyses indicate that there was tremendous lineage-specific duplication and diversification of kinesins in eukaryotes. Since the functions of only a few plant kinesins are reported in the literature, this comprehensive comparative analysis will be useful in designing functional studies with photosynthetic eukaryotes.


Figures
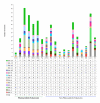
Figure 1
Figure 1
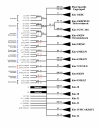
Number and distribution of kinesins. Tabular and graphical representation of the number of kinesins found in completely sequenced genomes used in our analysis. The number of kinesins is shown on the y-axis with the 19 species displayed across the x-axis. Different colors represent the distribution of kinesins into specific families. The data table below the chart details the specific number of kinesins in each family per species. For individual sequence IDs, please see Tables 2 through 7 and Additional files 1 through 12. Cm, Cyanidoschyzon merolae; Cr, Chlamydomonas reinhardtii; At, Arabidopsis thaliana; Pt, Populus trichocarpa; OsJ, Oryza sativa ssp. Japonica; OsI, Oryza sativa ssp. Indica; Tp, Thallassiosira pseudonana; Dm, Drosophila melanogaster; Hs, Homo sapiens; Ce, Caenorhabditis elegans; Sc, Saccharomyces cerevisiae; Sp, Schizosaccharomyces pombe; pc, Phaenerochaete chryosporium; Ps, Phytopthora sojae, Ci, Ciona intestinalis; Pf; Plasmodiumfalciparum; Dd, Dictyostelium discoideum; Lm, Leishmania major; Gl, Giardia lamblia.
Figure 2
Figure 2
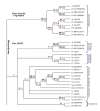
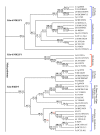
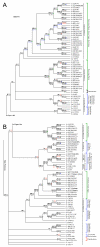
Unrooted Bayesian tree of the 529 kinesins based on their motor domain ami no-acid-plus-gap-characters. Support values from each parsimony and Bayesian analysis are presented adjacent to the nodes. Support values above each branch correspond to Bayesian posterior probabilities whereas values below each branch correspond to parsimony jackknife support. In both cases the leftmost values are for the amino-acid-plus-gap-characters analyses and the rightmost values are for amino-acid-characters analyses. Bayesian posterior probabilities for the amino-acid-plus-gap-characters are also shown in bold. If a branch was unresolved in one of the other three analyses, it is indicated by "-" at the respective node. If a branch was contradicted in one of these other three analyses, it is indicated by underlined red font at the respective node with the single highest posterior probability or jackknife support value for the contradicting clade(s) shown. Ungrouped kinesins are presented on the left side of the main polytomy, with the exception of the plant-specific ungrouped family that is shown on the upper right of the tree. The Ps and Lm unresolved blocks each contain 4 and 9 sequences, respectively (See Additional files 7 and 11 these sequence IDs). Brackets denote the major eukaryotic groupings in accordance with Baldauf's nomenclature [50]. Blue brackets indicate taxa that are from multiple groups, black brackets indicate protozoan species and red brackets are reserved for opisthokonts. Although Pt00151235 is grouped within this family by Bayesian analysis, we favor the parsimony resolution of it as a member of the Kinesin-10 family. For full names of species see Fig. 1 legend.
Figure 3
Figure 3
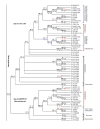
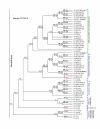
Expanded view of plant-specific ungrouped kinesins and Kinesin-1 family. Expansion of the plant-specific ungrouped and Kinesin-1 clades from Fig. 2. Green brackets indicate plant specific groups, mixed clades are shown in blue brackets and black brackets indicate protozoan species. Green circle and blue square indicate gene duplications in flowering plants and dicots, respectively. See Fig. 2 legend for an explanation of support values. Support values in italicized blue font indicate those clades supported in the parsimony analyses except for the exclusion of Ps 128382 (see text). For full names of species see Fig. 1 legend. Fl. Plants, flowering plants.
Figure 4
Figure 4
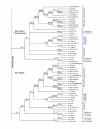
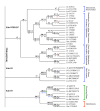
Expanded view of Kinesin-2 and Kinesin-3 families. Expansion of the Kinesin-2 and Kinesin-3 families from Fig. 2. There are no plant kinesins present in either of these families. Red brackets indicate opisthokonts, mixed clades are shown in blue brackets and black brackets indicate protozoan species. See Fig. 2 legend for an explanation of support values. For full names of species see Fig. 1 legend.
Figure 5
Figure 5
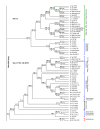
Expanded view of Kinesin-4 and Kinesin-5 families. Expansion of the Kinesin-4 and Kinesin-5 families from Figure 2. Experimentally studied Arabidopsis kinesins are indicated in parenthesis with their published names in bold. Green brackets indicate plant-specific groups, mixed clades are shown in blue brackets and red brackets indicate groupings composed of opisthokonts. Green circles and blue squares indicate gene duplications in flowering plants and dicots, respectively. See Fig. 2 legend for an explanation of support values. For full names of species see Fig. 1 legend.
Figure 6
Figure 6
Expanded view of Kinesin-6 and Kinesin-8 families. Expansion of the Kinesin-6 and Kinesin-8 families from Fig. 2. Mixed clades are shown in blue brackets and red brackets indicate groupings composed of opisthokonts. See Fig. 2 legend for an explanation of support values. For full names of species see Fig. 1 legend. Fl. Plants, flowering plants.
Figure 7
Figure 7
Expanded view of Kinesin-7 family. Expansion of the Kinesin-7 family from Fig. 2. Experimentally studied Arabidopsis kinesins are indicated in parenthesis with their published names in bold. Green brackets indicate plant specific groups, mixed clades are shown in blue brackets and black brackets indicate protozoan species. Green circles, blue squares and a red triangle indicate gene duplications in flowering plants, dicots and monocots, respectively. See Fig. 2 legend for an explanation of support values. For full names of species see Fig. 1 legend. Fl. Plants, flowering plants.
Figure 8
Figure 8
Expanded view of Kinesin-9 and Kinesin-10 families. Expansion of the Kinesin-9 and Kinesin-10 families from Fig. 2. An experimentally studied Arabidopsis kinesin is indicated in parenthesis with its published name in bold. Green brackets indicate plant-specific groups, mixed clades are shown in blue brackets and red brackets indicate groupings composed of opisthokonts. Green circle and blue square indicate gene duplications in flowering plants and dicots, respectively. See Fig. 2 legend for an explanation of support values. Support values in italicized blue font indicate those clades supported in the parsimony analyses except for the inclusion of Pt 00151235 (see text). For full names of species see Fig. 1 legend. Fl. Plants, flowering plants.
Figure 9
Figure 9
Expanded view of Kinesin-12 and Kinesin-13 families. Expansion of the Kinesin-12 and Kinesin-13 families from Fig. 2. Experimentally studied Arabidopsis kinesins are indicated in parenthesis with their published names in bold. Green brackets indicate plant specific groups, mixed clades are shown in blue brackets, black brackets indicate protozoan species and red brackets indicate groupings composed of opisthokonts. Purple diamond indicates a gene duplication after the divergence of red and green algae from one another yet prior to the divergence of green algae from flowering plants. Green circles and blue squares indicate gene duplications in flowering plants and dicots, respectively. See Fig. 2 legend for an explanation of support values. Support values in italicized blue font indicate those clades supported in the parsimony analyses except for the exclusion of Pt 00151235 (see text). For full names of species see Fig. 1 legend. Fl. Plants, flowering plants.
Figure 10
Figure 10
Expanded view of Kinesin-14 family. Expansion of the Kinesin-14 family from Fig. 2. Motor domain localizations are indicated adjacent to taxon labels. Experimentally studied Arabidopsis kinesins are indicated in parenthesis with its published name in bold. Green brackets indicate plant specific groups, mixed clades are shown in blue brackets, black brackets indicate protozoan species and red brackets indicate groupings composed of opisthokonts. Green circles, blue squares and a red triangle indicate gene duplications in flowering plants, dicots and monocots, respectively. See Fig. 2 legend for an explanation of support values. For full names of species see Fig. 1 legend.
Figure 11
Figure 11
Distribution of domains found within kinesins of 19 species. Schematic showing the presence or absence of particular domains and which families these domains are found in across the 19 species sampled. Species are listed horizontally across the top of the figure with the various domains listed vertically. Presence of a domain is indicated by a solid circle and its absence by a hollow circle. LH2, Lipoxygenase; Syn, N-terminal Syntaxin; MyTH4, Myosin Tail Homology 4; ARM, Armadillo; VWA, Von Willebrand Factor, Type A; ZF, Zinc finger; KR, Kinesin-Related; CH, Calponin Homology; HTH, Helix-Turn-Helix; HHH, Helix-Hairpin-Helix; FHA, Fork Head Associated; PH, Pleckstrin homology; CAP-Gly, Glycine rich domain found in Cytoskeleton Associated Proteins (CAPs); GGL, G-protein gamma motif like; WD-40, A 40 amino acid repeat motif with W and D dipeptides at the terminus; 3' Exo, 3' Exoribonuclease; CNB, Cyclic Nucleotide Binding; TPR, Tetratricopeptide repeat; MFS, Major Facilitator Superfamily; TM, Transmembrane; IPRP; Inositol polyphospate related phosphatase; C2, Protein kinase C conserved region 2; VHS, Domain present in Vps-27, Hrs, STAM; MORN, Membrane occupation and recognition nexus. In T. pseudonana, most kinesins are short (Table 7 and Figure 12), which could be due to poor quality of the gene models. Hence, it is possible that they contain additional domains. For full names of species see Fig. 1 legend.
Figure 12
Figure 12
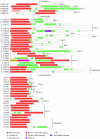
Domain schematics for unicellular photosynthetic eukaryotes. Schematic diagrams showing the domain architecture of kinesins in C. merolae, C. reinhardtii and T. pseudonana. Family classifications are shown to the right of the proteins.
Figure 13
Figure 13
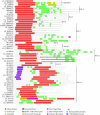
Domain schematics for P. trichocarpa. Schematic diagram showing the domain architecture of kinesins in P. trichocarpa. Family classifications are shown to the right of the proteins.
Figure 14
Figure 14
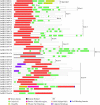
Domain schematics for O. sativa ssp. japonica. Schematic diagram showing the domain architecture of kinesins in O. sativa ssp. japonica. Family classifications are shown to the right of the proteins.
Figure 15
Figure 15
Duplication map for O. sativa ssp. japonica kinesins. Figure showing the approximated distribution of Oryza kinesins on a chromosomal duplication map based upon [94]. All accession numbers should be prefixed with "OSBCCO" if searching [100].

Similar articles

Cited by

References

    1. Reddy ASN. Molecular motors and their functions in plants. Int Rev Cytol & Cell Bio. 2001;204:97–178. - PubMed
    1. Vale RD. The molecular motor toolbox for intracellular transport. Cell. 2003;112:467–480. doi: 10.1016/S0092-8674(03)00111-9. - DOI - PubMed
    1. Hirokawa N. Kinesin and dynein superfamily proteins and the mechanism of organelle transport. Science. 1998;279:519–526. doi: 10.1126/science.279.5350.519. - DOI - PubMed
    1. Mermall V, Post PL, Mooseker MS. Unconventional myosins in cell movement, membrane traffic, and signal transduction. Science. 1998;279:527–533. doi: 10.1126/science.279.5350.527. - DOI - PubMed
    1. Goldstein LSB, Philip AV. The road less traveled: Emerging principles of kinesin motor utilization. Annu Rev Cell Dev Biol. 1999;15:141–183. doi: 10.1146/annurev.cellbio.15.1.141. - DOI - PubMed

Publication types

MeSH terms