. 2006 Jan 30;172(3):347-62.
doi: 10.1083/jcb.200507003.

Asynchronous nuclear division cycles in multinucleated cells

Affiliations

Asynchronous nuclear division cycles in multinucleated cells

Amy S Gladfelter et al. J Cell Biol. .

Abstract

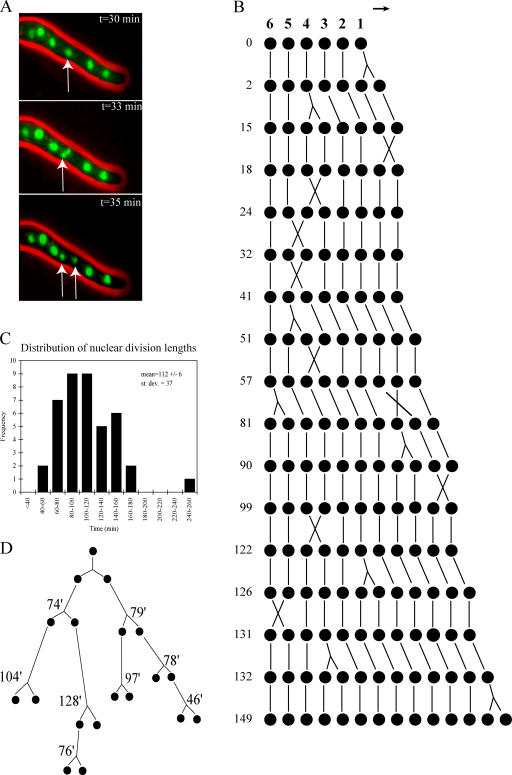
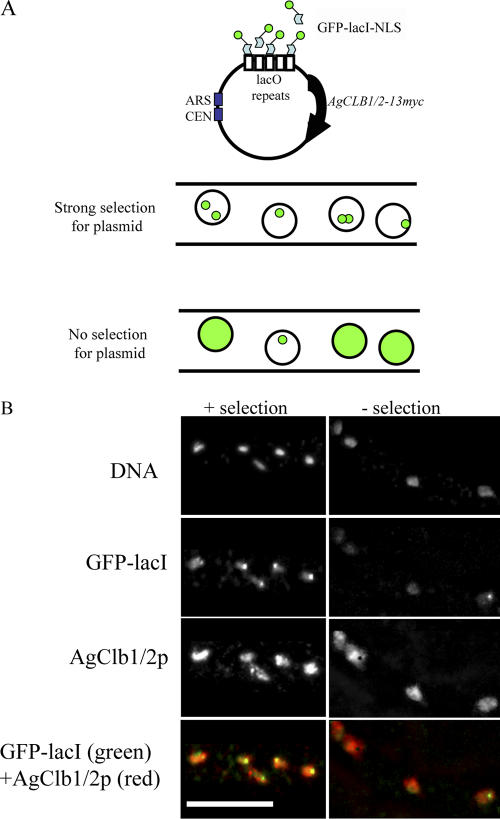
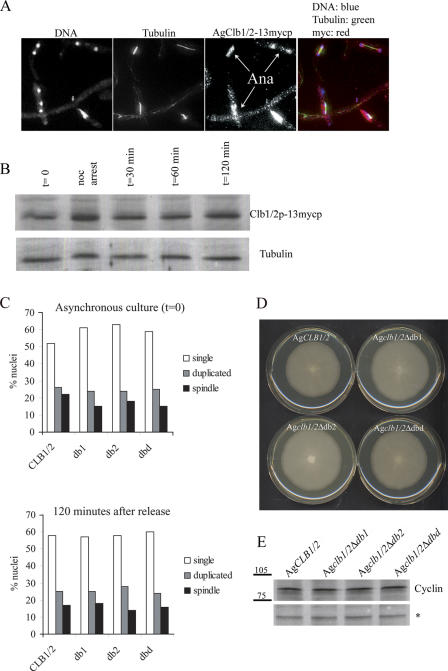
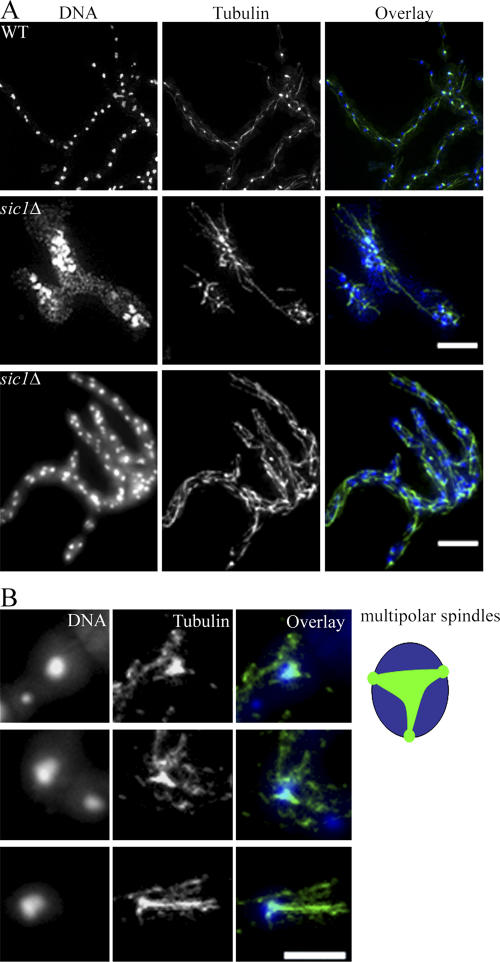
Synchronous mitosis is common in multinucleated cells. We analyzed a unique asynchronous nuclear division cycle in a multinucleated filamentous fungus, Ashbya gossypii. Nuclear pedigree analysis and observation of GFP-labeled spindle pole bodies demonstrated that neighboring nuclei in A. gossypii cells are in different cell cycle stages despite close physical proximity. Neighboring nuclei did not differ significantly in their patterns of cyclin protein localization such that both G1 and mitotic cyclins were present regardless of cell cycle stage, suggesting that the complete destruction of cyclins is not occurring in this system. Indeed, the expression of mitotic cyclin lacking NH(2)-terminal destruction box sequences did not block cell cycle progression. Cells lacking AgSic1p, a predicted cyclin-dependent kinase (CDK) inhibitor, however, showed aberrant multipolar spindles and fragmented nuclei that are indicative of flawed mitoses. We hypothesize that the continuous cytoplasm in these cells promoted the evolution of a nuclear division cycle in which CDK inhibitors primarily control CDK activity rather than oscillating mitotic cyclin proteins.


Figures

Figure 1.
Figure 1.
Mitoses are asynchronous in multinucleated A. gossypii cells. (A) Individual frames from a time-lapse video recording the growth of a strain (HHF1-GFP) with histone-GFP–labeled nuclei. The nuclei indicated by the arrows divide independently from their neighbors. Pictures were acquired every 30 s. (B) Example of a nuclear pedigree demonstrating the capacity for all nuclei to divide. Six starting parent nuclei were followed through subsequent nuclear divisions. Numbers are time in minutes from start of time-lapse acquisition. A total of 11 such pedigrees were performed on independent hyphae. In the pedigree diagram, X is a by-passing event, an upside-down Y is a mitosis, and the arrow denotes the direction of growth. (C) Histogram summarizing variability in nuclear division cycle length from 41 mitoses observed in time-lapse videos of HHF1-GFP strains. (D) Nuclear lineage demonstrating variability in nuclear division cycle length within related nuclei, where the time in minutes represents the time between nuclear divisions.
Figure 2.
Figure 2.
Neighboring nuclei are in different cell cycle stages. Spores were grown overnight at 30°C until young mycelium were formed that contained ∼75–100 nuclei. In all panels, arrows highlight neighboring nuclei in different spindle stages. 1 indicates nuclei with a single SPB; 2 indicates nuclei with adjacent, duplicated SPBs or SPBs that are larger in diameter and ≥2× brighter than single SPBs; Meta indicates likely metaphase nuclei with a spindle aligned across the middle of the DNA; Ana indicates anaphase nuclei in which the spindle connects two separated DNA signals. (A) Tubulin visualization in wild-type cells by immunofluorescence using antitubulin antibody for spindle observation. (B) SPC42-GFP (ASG38) visualization for SPB observation. Proportions are the percentage of nuclei with one, two adjacent, or two separated metaphase/anaphase SPBs (n > 1,000). (C) Wild-type spores were grown for 12 h until a bipolar germling stage and incubated with nocodazole for 4 h. Cells were then washed before release into fresh media and processed at the indicated time points for tubulin immunofluorescence. Nuclei are in blue, and microtubules or SPBs are in green. Bars (A and C), 10 μm; (B) 5 μm.
Figure 3.
Figure 3.
Comparison of A. gossypii and S. cerevisiae cyclins. Domain comparison between AgCln1/2p, ScCln1p, and ScCln2p and, below, between AgClb1/2p, ScClb1p, and ScClb2p. The amino acid positions noted for motifs are for the A. gossypii homologue. The cyclin box was identified by a ProSite scan, and the PEST motif is based on Salama et al. (1994). The identity within the PEST domain is 30%, although all key Cdc28p phosphorylation sites are conserved. The D box (db1 [indicated by 1]; Ag aa 28–39; Glotzer et al., 1991), the COOH-terminal cyclin box (ProSite scan), one of two KEN boxes (Pfleger and Kirschner, 2000; Hendrickson et al., 2001), the NLS, and one of two NESs (Hood et al., 2001) are conserved in the A. gossypii CLB1/2 sequence. AgCLB1/2 appears to have an additional putative D-box sequence at aa 84–96 (db2; indicated by 2) and a more NH2-terminal KEN box at aa 6–8.
Figure 4.
Figure 4.
Cyclins are nuclear and present throughout all nuclear division stages. (A) Western blot on whole cell extracts showing recognition of epitope-tagged cyclins at 80 kD (arrow) with anti-myc antibody (ASG43 and ASG60) and the absence of a band in an untagged wild-type control strain. The load control is a nonspecific cross-reacting band marked by an asterisk, and the molecular mass marker is given in kilodaltons. All images in B–D are derived from stacks of images acquired in the Z axis and compressed to capture all possible signals in the hyphae. (B) Wild-type, untagged A. gossypii cells were processed for immunofluorescence and stained with the myc antibody to show the level of background fluorescence with this antibody. (C) Cyclins AgCln1/2-13mycp (ASG60) and AgClb1/2-13mycp (ASG43) were visualized along with tubulin by immunofluorescence. Individual nuclei are shown representing different spindle stages. All images were acquired and processed under identical conditions. (D) Images showing intact hyphae of AgCln1/2-13mycp and AgClb1/2-13mycp strains prepared as in C. Arrows highlight nuclei of different cell cycle stages as described for Fig. 2. In overlays, DNA is blue, tubulin is green, and cyclins are red, leading to purple nuclei containing cyclins. Bars (B and D), 10 μm; (C) 5 μm.
Figure 5.
Figure 5.
Cyclins are present in nuclei that are distinct from the site of expression. (A, top) Centromere-based plasmids containing an epitope-tagged AgCLB1/2 gene, lacO repeats, and a dominant drug resistance marker (GEN3) were constructed (pAKH38) that can replicate and segregate in A. gossypii nuclei. (bottom) A. gossypii GFP-lacI-NLS cell strains were transformed with the plasmid containing the AgCLB1/2-13myc and the lacO repeats. In the presence of the G418 drug, many nuclei show one or two tight dots of GFP signal that are indicative of plasmid. When the selective drug pressure is removed, within 5 h, the GFP signal is lost in the majority of nuclei, and GFP-lacI appears as a diffuse signal in the nucleoplasm, which is indicative of no plasmid. CEN, centromeric. (B) GFP-lacI-NLS + placO-CLB1/2-13myc (AKHAg28) were grown overnight for 16 h in 200 μg/ml G418 drug. Half of the cells were fixed before washing out the drug (left), and the remaining half of the cells were resuspended in fresh media lacking the selective drug and allowed to grow for 5 h before fixation (right). Cells were processed for immunofluorescence to visualize GFP-lacI-NLS and AgClb1/2-13mycp. Bar, 10 μm.
Figure 6.
Figure 6.
Displacement of AgClb1/2p to the cytoplasm with an exogenous NES. (A) AgCLB1/2-NESa-Myc (AKHAg19, active NES) or AgCLB1/2-NESi-Myc (AKHAg22, inactive NES control) were grown for 16 h and processed for antitubulin and anti-myc immunofluorescence. Images were captured and processed identically to compare protein intensities within the figure. Bar, 10 μm. (B) Percentage of nuclei in each spindle stage based on tubulin staining. n > 200 nuclei scored for each strain. M, mitotic.
Figure 7.
Figure 7.
AgClb1/2p levels do not diminish at mitotic exit, and cyclin mutants lacking D-box sequences have normal nuclear division. (A) Mitotic AgClb1/2-13mycp was visualized in young germling cells (ASG43) that were arrested and released from nocodazole. Clb1/2-13myc protein was evaluated by immunofluorescence and (B) on a Western blot, where tubulin was used as a loading control. Arrows highlight anaphase/telophase nuclei with mitotic cyclin. In overlays, DNA is blue, tubulin is green, and cyclins are red, leading to purple nuclei containing cyclins. (C) Wild-type strains were transformed with plasmids containing either AgCLB1/2, Agclb1/2-db1 (pAKH47), Agclb1/2-db2 (pAKH45), or Agclb1/2-dbd (pAKH46) and grown in liquid media containing G418 to maintain the plasmid in most nuclei. A subset of asynchronous cultures grown for 16 h were fixed and processed for antitubulin immunofluorescence, and nuclei were evaluated according to spindle stage (t = 0). The remaining cultures were then arrested and released from nocodazole, and percent nuclei in mitosis were evaluated at 120 min, the point at which wild-type cultures have just returned to normal asynchronous levels of mitosis. (D) Spores from cells containing AgCLB1/2, Agclb1/2-db1, Agclb1/2-db2, or Agclb1/2-dbd were inoculated on plates, and radial growth was evaluated after 5 d at 30°C. Similar growth rates were also observed when alleles are integrated in the genome at the ADE2 locus (not depicted). (E) Spores from cells containing AgCLB1/2-13myc, Agclb1/2-db1-13myc, Agclb1/2-db2-13myc, or Agclb1/2-dbd-13myc were inoculated into liquid media containing 150 μg/ml G418 for selection, grown for 16 h at 30°C, and lysed and processed for an anti-myc Western blot. The asterisk is a nonspecific cross-reacting band for a loading control. Molecular mass is shown in E in kilodaltons.
Figure 8.
Figure 8.
Agsic1Δ mutants arrest growth with abnormal nuclear distribution and spindle defects. (A) Agsic1Δ mutants (ASG65) were germinated in the presence of 50 μg/ml CloNAT to select for cells with the gene disrupted, were fixed and processed for antitubulin immunofluorescence, and compared with wild-type cells. The middle panels show the typical arrest phenotype of bipolar germlings, and the bottom panels show cells that arrest as a small mycelia and high nuclear density. Bars, 10 μm. (B) Higher magnification of nuclei showing multipolar spindle defects observed in Agsic1Δ cells. Nuclei are in blue, and microtubules are in green. Bar, 5 μm.
Figure 9.
Figure 9.
AgSic1p localization varies according to nuclear division cycle stage, and summary of A. gossypii nuclear division cycle. (A) AgSic1-13mycp (ASG61) cells were grown for 18 h and processed for antitubulin and anti-myc immunofluorescence. All images in the AgSic1p panel were taken with identical exposure times and processed in parallel with identical processing conditions. 82% of one-SPB nuclei, 76% of two-SPB nuclei, 75% of metaphase nuclei, 80% of early anaphase nuclei, and 79% of late anaphase/telophase nuclei showed signal as depicted by these representative nuclei (n = 400 total nuclei). (B) Summary of asynchronous nuclear division and localization of cell cycle regulators.

Similar articles

Cited by

References

    1. Alberti-Segui, C., F. Dietrich, R. Altmann-Johl, D. Hoepfner, and P. Philippsen. 2001. Cytoplasmic dynein is required to oppose the force that moves nuclei towards the hyphal tip in the filamentous ascomycete Ashbya gossypii. J. Cell Sci. 114:975–986. - PubMed
    1. Altmann-Johl, R., and P. Philippsen. 1996. AgTHR4, a new selection marker for transformation of the filamentous fungus Ashbya gossypii, maps in a four-gene cluster that is conserved between A. gossypii and Saccharomyces cerevisiae. Mol. Gen. Genet. 250:69–80. - PubMed
    1. Ayad-Durieux, Y., P. Knechtle, S. Goff, F. Dietrich, and P. Philippsen. 2000. A PAK-like protein kinase is required for maturation of young hyphae and septation in the filamentous ascomycete Ashbya gossypii. J. Cell Sci. 113:4563–4575. - PubMed
    1. Belmont, A.S., and A.F. Straight. 1998. In vivo visualization of chromosomes using lac operator-repressor binding. Trends Cell Biol. 8:121–124. - PubMed
    1. Chen, K.C., A. Csikasz-Nagy, B. Gyorffy, J. Val, B. Novak, and J.J. Tyson. 2000. Kinetic analysis of a molecular model of the budding yeast cell cycle. Mol. Biol. Cell. 11:369–391. - PMC - PubMed

Publication types

MeSH terms