. 2006 Jul;291(1):E23-37.
doi: 10.1152/ajpendo.00523.2005. Epub 2006 Jan 31.

Computational model of in vivo human energy metabolism during semistarvation and refeeding

Affiliations

Computational model of in vivo human energy metabolism during semistarvation and refeeding

Kevin D Hall. Am J Physiol Endocrinol Metab. 2006 Jul.

Abstract

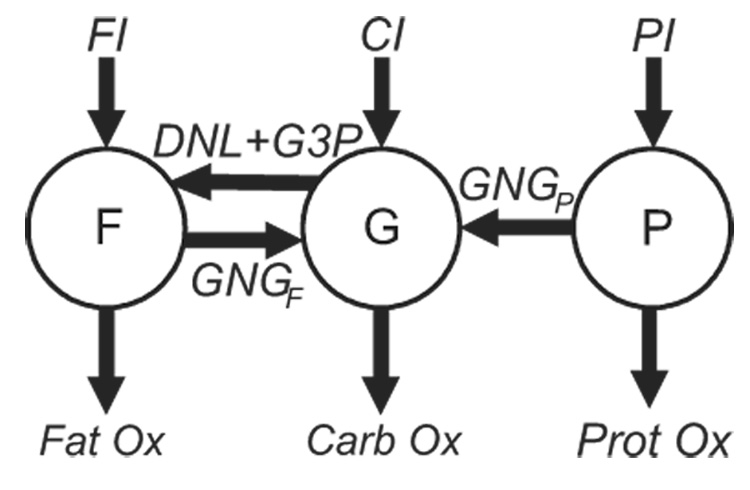
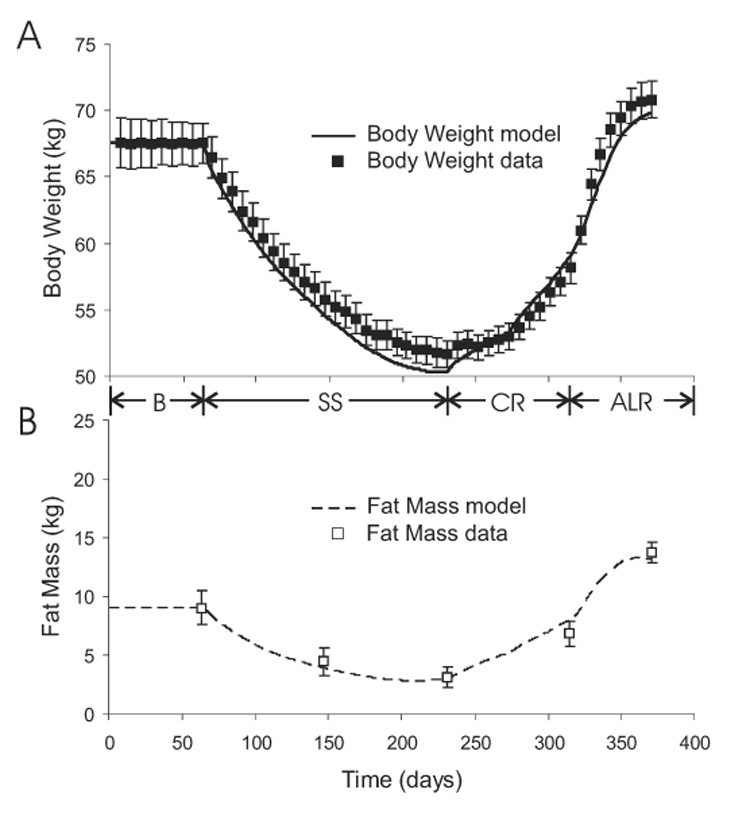
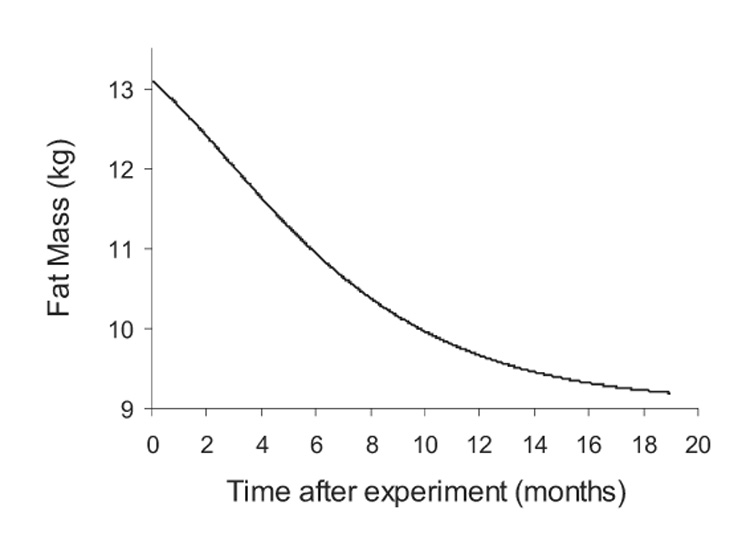
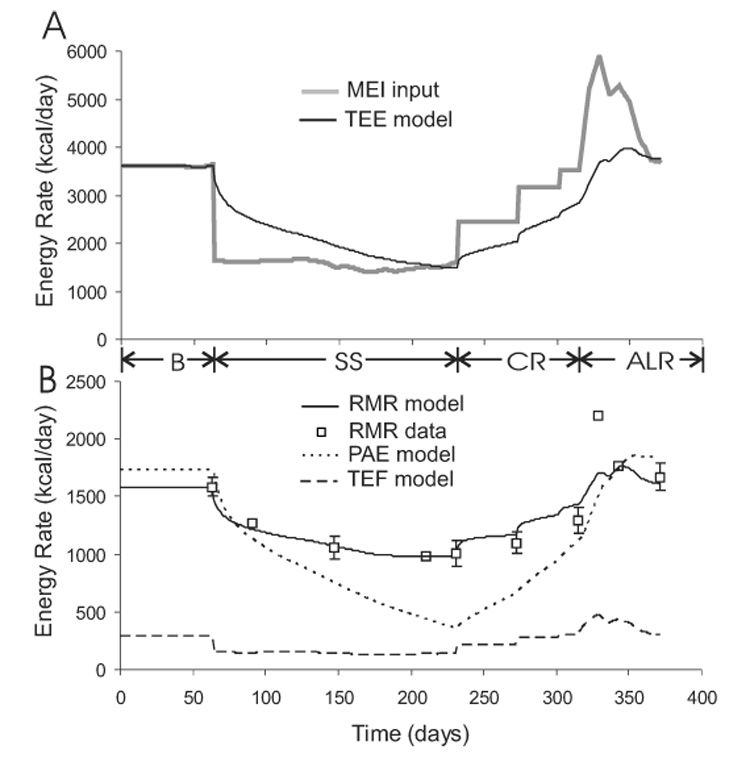
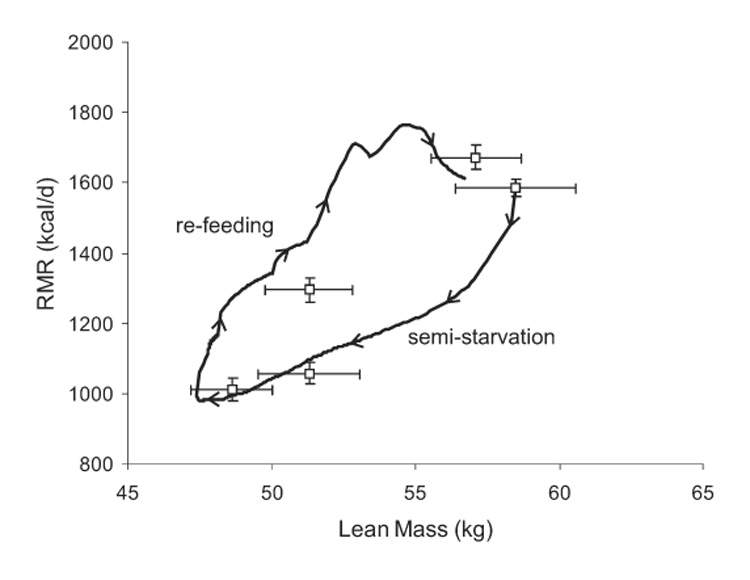
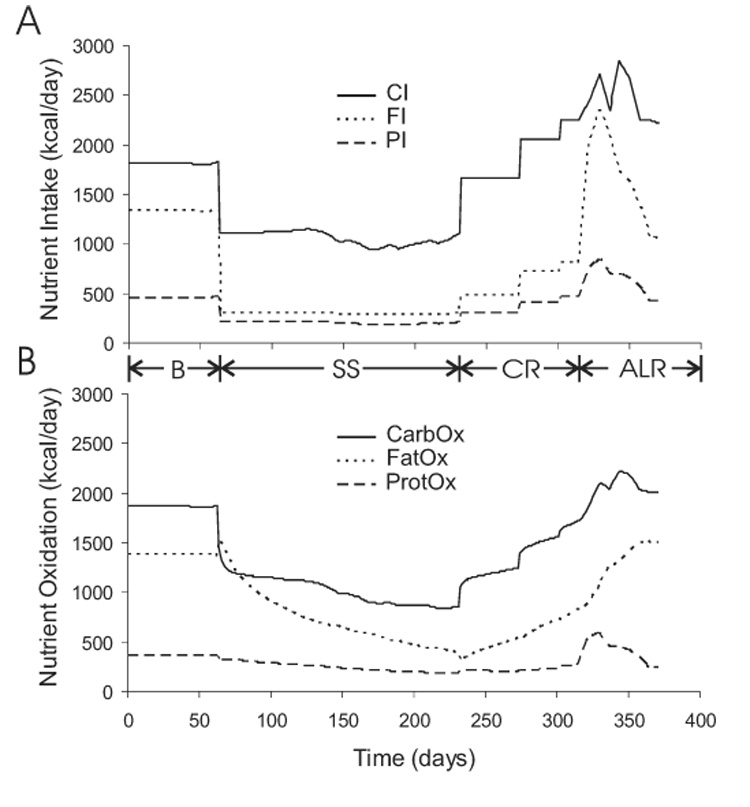
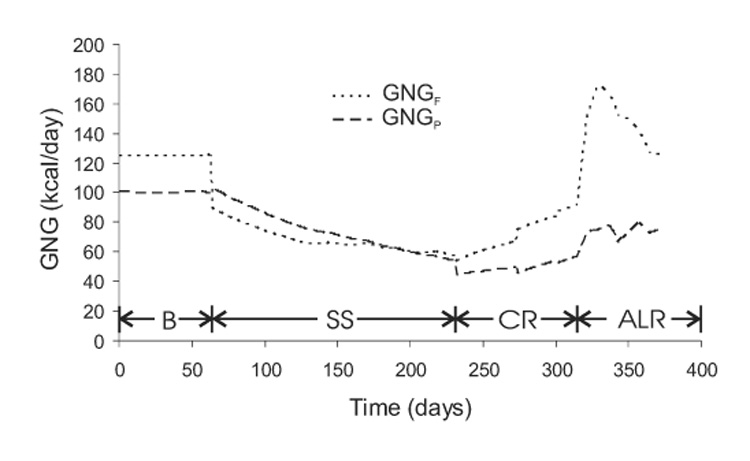
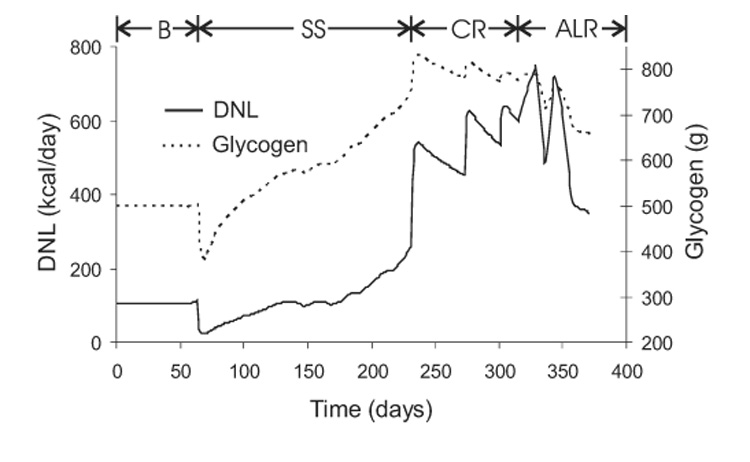
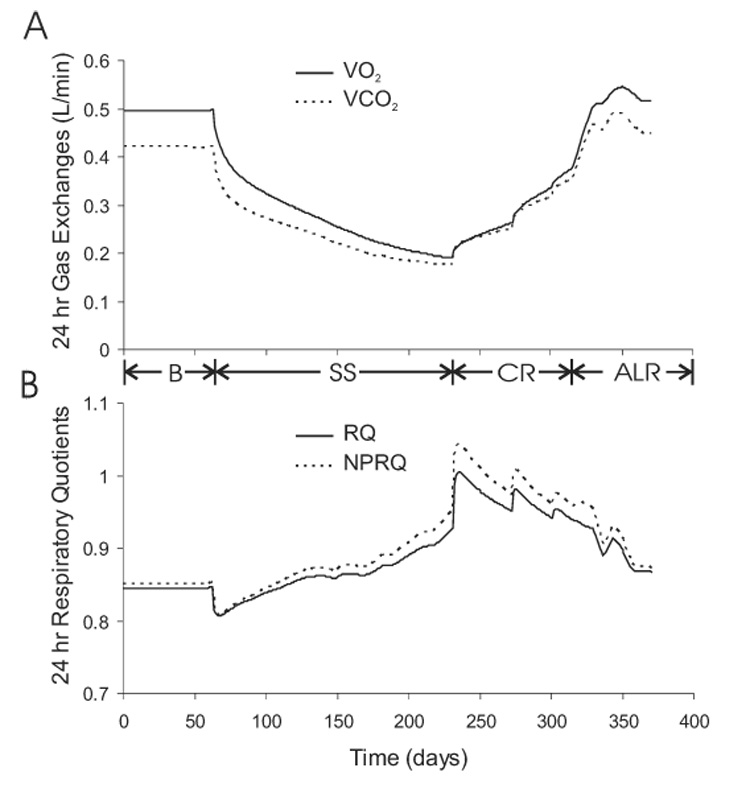
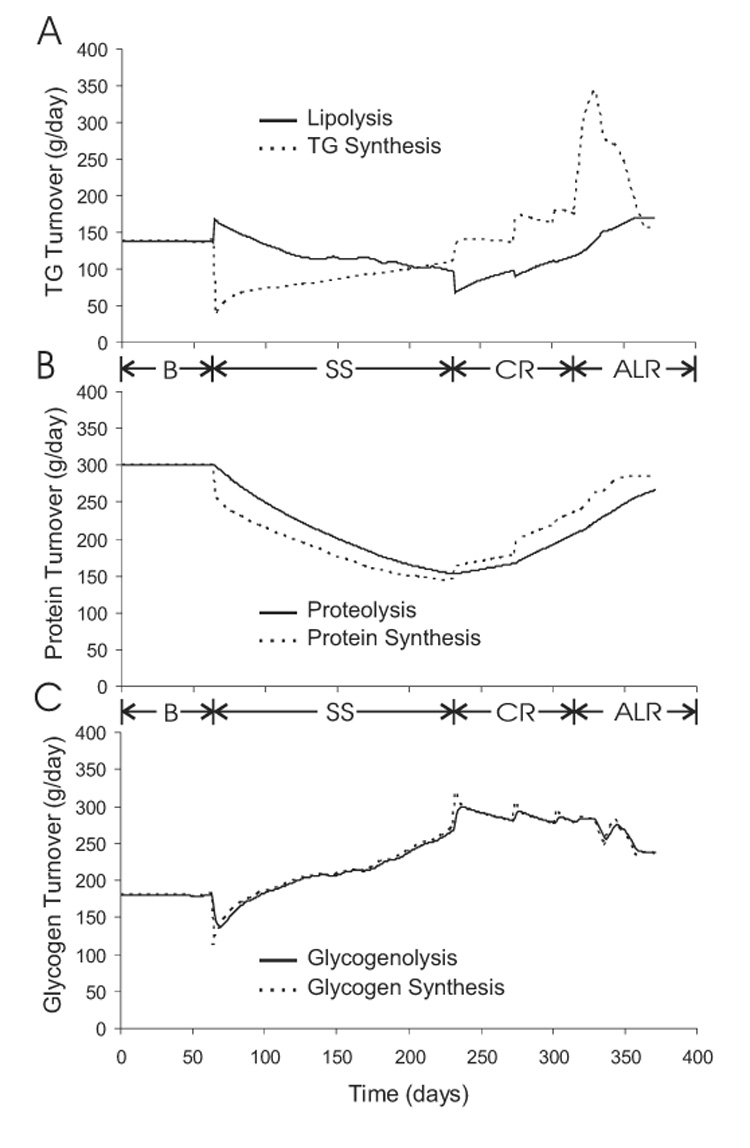
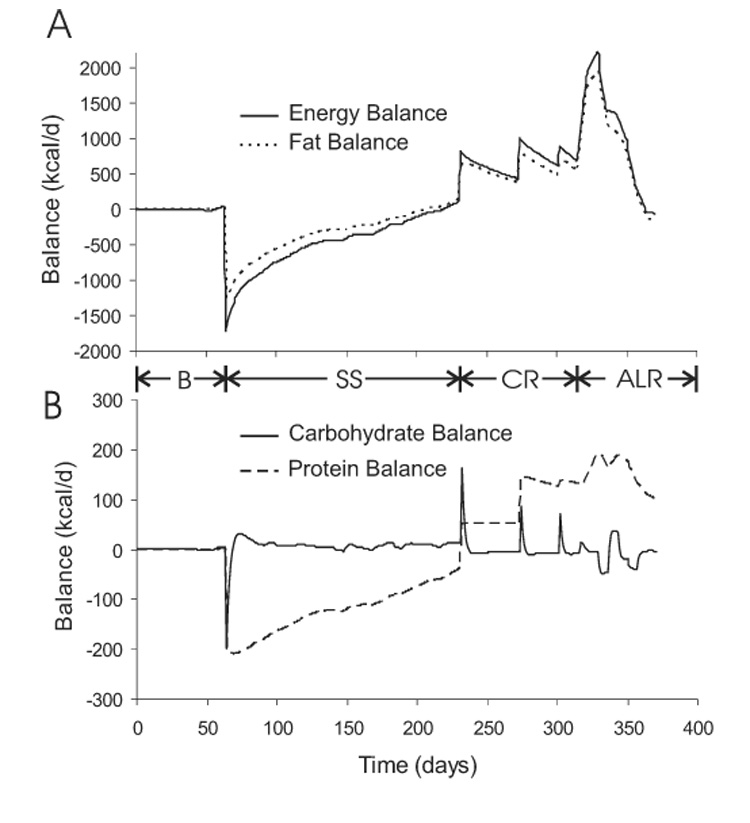
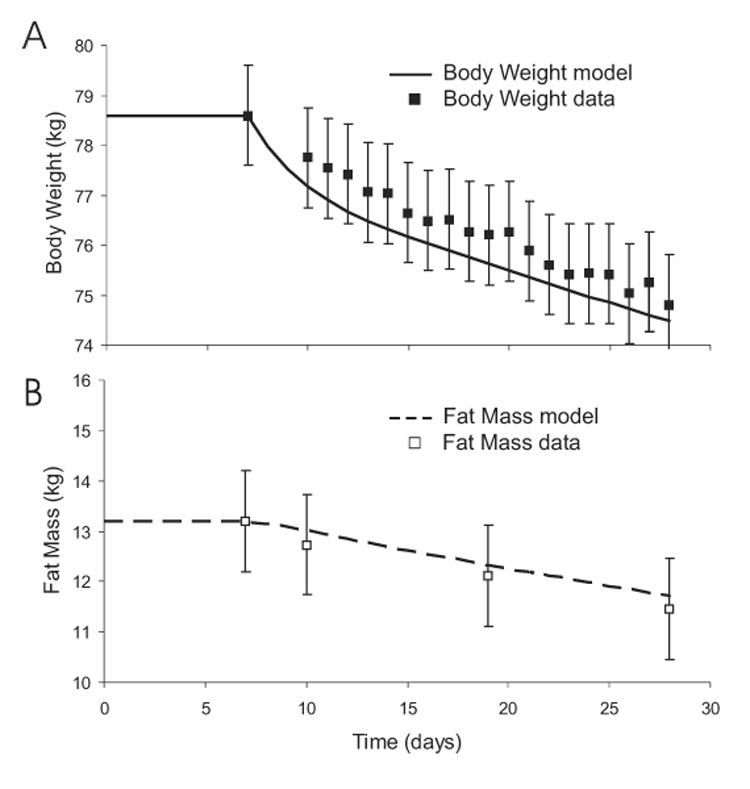
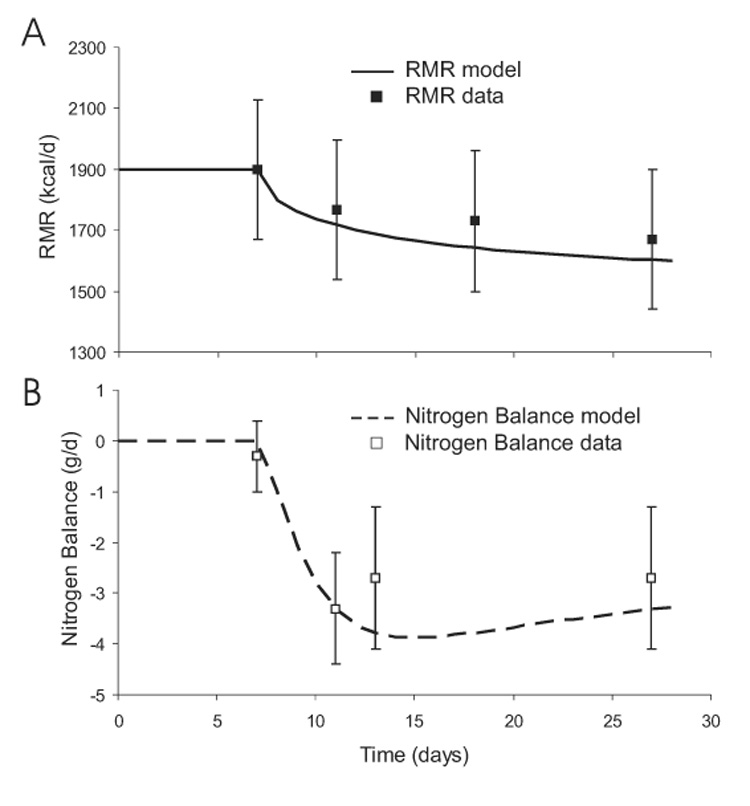
Changes in body weight and composition are the result of complex interactions among metabolic fluxes contributing to macronutrient balances. To better understand these interactions, a mathematical model was constructed that used the measured dietary macronutrient intake during semistarvation and refeeding as model inputs and computed whole body energy expenditure, de novo lipogenesis, and gluconeogenesis as well as turnover and oxidation of carbohydrate, fat, and protein. Published in vivo human data provided the basis for the model components that were integrated by fitting a few unknown parameters to the classic Minnesota human starvation experiment. The model simulated the measured body weight and fat mass changes during semistarvation and refeeding and predicted the unmeasured metabolic fluxes underlying the body composition changes. The resting metabolic rate matched the experimental measurements and required a model of adaptive thermogenesis. Refeeding caused an elevation of de novo lipogenesis that, along with increased fat intake, resulted in a rapid repletion and overshoot of body fat. By continuing the computer simulation with the prestarvation diet and physical activity, the original body weight and composition were eventually restored, but body fat mass was predicted to take more than one additional year to return to within 5% of its original value. The model was validated by simulating a recently published short-term caloric restriction experiment without changing the model parameters. The predicted changes in body weight, fat mass, resting metabolic rate, and nitrogen balance matched the experimental measurements, thereby providing support for the validity of the model.


Figures

Figure 1
Figure 1
Schematic of the nutrient balance model. Changes of the body fat (F), glycogen (G), and protein (P) were determined by the balance of fat, carbohydrate, and protein intake (FI, CI, and PI, respectively), gluconeogenesis from fat (GNGF) and protein (GNGP), de novo lipogenesis (DNL), glycerol 3-P synthesis (G3P), and the oxidation of fat (Fat Ox), carbohydrate (Carb Ox), and protein (Prot Ox), respectively.
Figure 2
Figure 2
Model simulation (curves) and experimental measurements (boxes) of body weight (panel A) and fat mass (panel B) during baseline (B), semi-starvation (SS), controlled re-feeding (CR), and ad libitum re-feeding (ALR) phases of the Minnesota human starvation experiment.
Figure 3
Figure 3
Model simulation of the time required to recover the original 9 kg of body fat mass after the termination of the Minnesota experiment.
Figure 4
Figure 4
A) Model simulation of total energy expenditure, TEE, in response to imposed changes of metabolizable energy intake, MEI, during the Minnesota experiment. B) Simulated components of total energy expenditure including resting metabolic rate, RMR, physical activity expenditure, PAE, and the thermic effect of feeding, TEF. The experimental RMR measurements (□) are also shown. A few RMR data points do not have error bars since the uncertainties for these values were unreported.
Figure 5
Figure 5
Model simulation (curve) and measurements (□) of RMR versus lean body mass where the sequence of events is indicated by the arrows on the curve traced during the simulation. The measured RMR when the lean mass was 51.3 ± 1.5 kg was significantly lower during semi-starvation than during re-feeding (P < 0.0001).
Figure 6
Figure 6
Imposed changes of macronutrient intake (panel A) and the simulated adaptation of macronutrient oxidation (panel B) during the Minnesota experiment.
Figure 7
Figure 7
Simulated gluconeogenic rates from carbon derived from protein (GNGP) and glycerol (GNGF) during the Minnesota experiment.
Figure 8
Figure 8
Simulated variations of de novo lipogenesis (DNL) and whole-body glycogen content during the Minnesota experiment.
Figure 9
Figure 9
Simulated daily oxygen consumption (VO2) and carbon dioxide production (CO2) (panel A), along with the daily respiratory quotient (RQ) and non-protein respiratory quotient (NPRQ) (panel B) during the Minnesota experiment.
Figure 10
Figure 10
Simulated turnover rates of triacylglycerol (TG) (panel A), protein (panel B), and glycogen (panel C) during the Minnesota experiment.
Figure 11
Figure 11
Simulated variations of energy and fat balance (panel A) as well as carbohydrate and protein balance (panel B) during the Minnesota experiment.
Figure 12
Figure 12
Predicted changes of body weight (panel A) and fat mass (panel B) during a three week caloric restriction experiment. Other than the initial balanced values, no model parameters were changed to simulate the data (boxes) from this experiment.
Figure 13
Figure 13
Predicted changes of RMR (panel A) and nitrogen balance (panel B) during a three week caloric restriction experiment.

References

    1. Aarsland A, Chinkes D, Wolfe RR. Hepatic and whole-body fat synthesis in humans during carbohydrate overfeeding. Am J Clin Nutr. 1997;65:1774–1782. - PubMed
    1. Acheson KJ, Schutz Y, Bessard T, Anantharaman K, Flatt JP, Jequier E. Glycogen storage capacity and de novo lipogenesis during massive carbohydrate overfeeding in man. Am J Clin Nutr. 1988;48:240–247. - PubMed
    1. Alberts B, Bray D, Lewis J, Raff M, Roberts K, Watson JD. Molecular Biology of the Cell. 3rd ed. New York: Garland; 1994.
    1. Alpert SS. A two-reservoir energy model of the human body. Am J Clin Nutr. 1979;32:1710–1718. - PubMed
    1. Alpert SS. A limit on the energy transfer rate from the human fat store in hypophagia. J Theor Biol. 2005;233:1–13. - PubMed

Publication types

LinkOut - more resources