. 2006 Mar;16(3):383-93.
doi: 10.1101/gr.4410706. Epub 2006 Jan 31.

High-throughput DNA methylation profiling using universal bead arrays

Affiliations

High-throughput DNA methylation profiling using universal bead arrays

Marina Bibikova et al. Genome Res. 2006 Mar.

Abstract

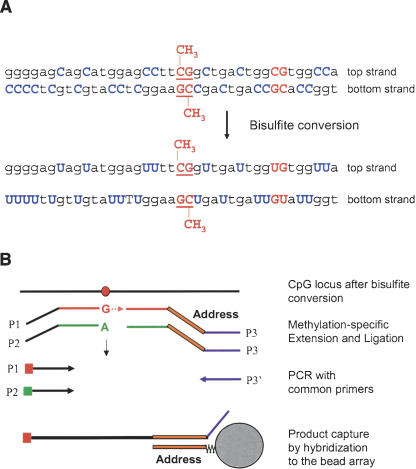
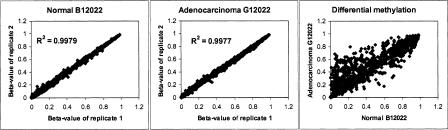
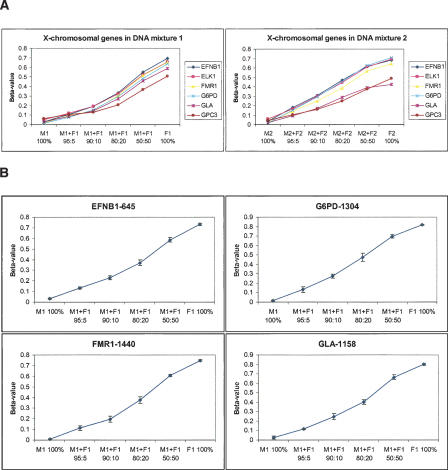
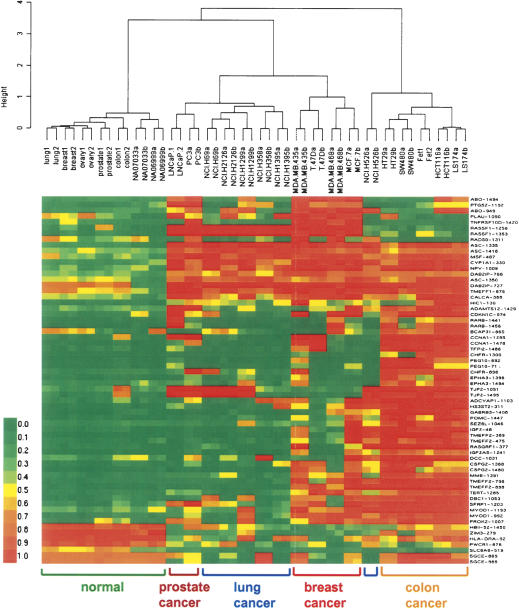
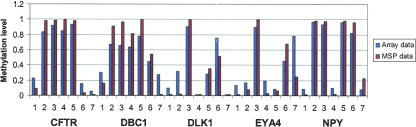
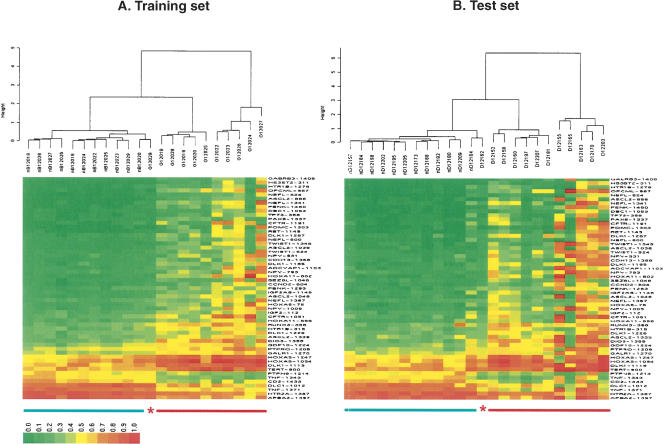
We have developed a high-throughput method for analyzing the methylation status of hundreds of preselected genes simultaneously and have applied it to the discovery of methylation signatures that distinguish normal from cancer tissue samples. Through an adaptation of the GoldenGate genotyping assay implemented on a BeadArray platform, the methylation state of 1536 specific CpG sites in 371 genes (one to nine CpG sites per gene) was measured in a single reaction by multiplexed genotyping of 200 ng of bisulfite-treated genomic DNA. The assay was used to obtain a quantitative measure of the methylation level at each CpG site. After validating the assay in cell lines and normal tissues, we analyzed a panel of lung cancer biopsy samples (N = 22) and identified a panel of methylation markers that distinguished lung adenocarcinomas from normal lung tissues with high specificity. These markers were validated in a second sample set (N = 24). These results demonstrate the effectiveness of the method for reliably profiling many CpG sites in parallel for the discovery of informative methylation markers. The technology should prove useful for DNA methylation analyses in large populations, with potential application to the classification and diagnosis of a broad range of cancers and other diseases.


Figures

Figure 1.
Figure 1.
DNA methylation assay scheme. (A) Bisulfite conversion of DNA. (B) For each CpG site, two pairs of probes were designed to interrogate either the top or bottom strand: an allele-specific oligonucleotide (ASO) and locus-specific oligonucleotide (LSO) probe pair for the methylated state of the CpG site and a corresponding ASO-LSO pair for the unmethylated state. Each ASO consists of a 3′-portion that hybridizes to the bisulfite-converted genomic DNA, with the 3′-base complementary to either the “C” or “T” allele of the targeted CpG site, and a 5′-portion that incorporates a universal PCR primer sequence P1 or P2. The LSOs consist of three parts: At the 5′-end is a CpG locus-specific sequence; in the middle is an address sequence, complementary to a corresponding capture sequence on the array; and at the 3′-end is a universal PCR priming site (P3). Pooled assay oligonucleotides were first annealed to bisulfite-converted genomic DNA. An allele-specific primer extension step was then carried out; ASOs were extended only if their 3′-base was complementary to their cognate CpG site in the gDNA template. Allele-specific extension was followed by ligation of the extended ASOs to their corresponding LSOs, to create PCR templates. The ligated products were then amplified by PCR using common primers P1, P2, and P3′, and hybridized to a microarray bearing the complementary address sequences. P1 and P2 were fluorescently labeled, each with a different dye, and associated with the “T” (unmethylated) allele or the “C” (methylated) allele, respectively.
Figure 2.
Figure 2.
Methylation assay reproducibility and differential methylation detection. Comparison of methylation profiles between lung cancer and matching normal tissue. The β-value (i.e., the methylation ratio measured for all 1536 CpG sites) obtained from one replicate experiment is plotted against that obtained from another technical replicate experiment. The left and center panels show the reproducibility of replicated assays on DNAs derived from lung adenocarcinoma G12022 (center) and its matching normal tissue (left). The right panel shows the comparison between the normal and the matching adenocarcinoma samples.
Figure 3.
Figure 3.
Methylation detection in gDNA mixtures. (A) Female genomic DNA was diluted with male genomic DNA at ratios of 5:95, 10:90, 20:80, and 50:50. Two sets of mixtures were made and measured: M1 (male NA10923)/F1 (female NA10924) and M2 (male NA07033)/F2 (female NA06999). Methylation levels of six X chromosome-linked genes were calculated as the average of several (one to five) CpG sites for each gene. (B) Methylation profiles of individual CpG sites (only four are shown). Error bars represent the standard deviation of β-values calculated from four replicate experiments, done with the first set of mixtures (NA10923/NA10924).
Figure 4.
Figure 4.
Methylation profiling in cancer cell lines. Seven DNA samples derived from different normal tissues and 17 colon, breast, lung, and prostate cancer cell lines were profiled. All cancer samples were correctly separated from normal samples using agglomerative clustering based on 64 cancer-specific methylation makers, and highly specific methylation signatures were obtained for each cancer type. Green, yellow, and red colors represent low, medium, and high methylation levels, respectively.
Figure 5.
Figure 5.
Comparison of methylation-specific PCR and array-based methylation data. MSP was used to confirm the methylation status of CpG sites within the promoter regions of five genes that showed distinct methylation profiles in one normal lung tissue and six lung cancer cell lines from array-based methylation analysis (1: normal lung tissue; 2: NCI-H69; 3: NCI-H526; 4: NCI-H358; 5: NCI-H1299; 6: NCI-H1395; and 7: NCI-H2126). The methylation level is represented as bars, blue for microarray data and red for MSP data.
Figure 6.
Figure 6.
Cluster analysis of lung adenocarcinoma samples. (A) Eleven cancer and 11 normal tissue samples were used as a training set to identify a list of 55 CpG sites that are differentially methylated in cancer versus normal tissues with high confidence level (adjusted P-value < 0.001) and significant change in absolute methylation level (|Δβ| > 0.15). Cancer sample G12029 was mistakenly coclustered with normal samples. (B) The selected 55 CpG sites were used for classification of an independent test sample set of 12 lung adenocarcinoma and 12 normal tissue samples, collected from a different institute. All the normal and cancer samples were separated into two distinguished groups with a single error—cancer sample D12162 was coclustered with normal samples. Normal samples are underlined in green, cancer in red. The asterisks indicate misclassified samples.

Similar articles

Cited by

References

    1. Adorjan, P., Distler, J., Lipscher, E., Model, F., Muller, J., Pelet, C., Braun, A., Florl, A.R., Gutig, D., Grabs, G., et al. 2002. Tumour class prediction and discovery by microarray-based DNA methylation analysis. Nucleic Acids Res. 30 e21. - PMC - PubMed
    1. Akama, T.O., Okazaki, Y., Ito, M., Okuizumi, H., Konno, H., Muramatsu, M., Plass, C., Held, W.A., and Hayashizaki, Y. 1997. Restriction landmark genomic scanning (RLGS-M)-based genome-wide scanning of mouse liver tumors for alterations in DNA methylation status. Cancer Res. 57 3294–3299. - PubMed
    1. Alaminos, M., Davalos, V., Cheung, N.K., Gerald, W.L., and Esteller, M. 2004. Clustering of gene hypermethylation associated with clinical risk groups in neuroblastoma. J. Natl. Cancer Inst. 96 1208–1219. - PubMed
    1. Balmain, A., Gray, J., and Ponder, B. 2003. The genetics and genomics of cancer. Nat. Genet. 33 Suppl: 238–244. - PubMed
    1. Barker, D.L., Theriault, G., Che, D., Dickinson, T., Shen, R., and Kain, R. 2003. Self-assembled random arrays: High-performance imaging and genomics applications on a high-density microarray platform. Proc. SPIE 4966 1–11.

Publication types

LinkOut - more resources