. 2006 Jun 1;107(11):4458-65.
doi: 10.1182/blood-2005-12-4788. Epub 2006 Jan 31.

Antigen receptor-mediated changes in glucose metabolism in B lymphocytes: role of phosphatidylinositol 3-kinase signaling in the glycolytic control of growth

Affiliations

Antigen receptor-mediated changes in glucose metabolism in B lymphocytes: role of phosphatidylinositol 3-kinase signaling in the glycolytic control of growth

Cheryl A Doughty et al. Blood. .

Abstract

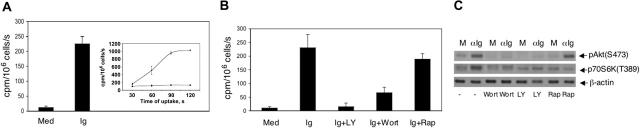
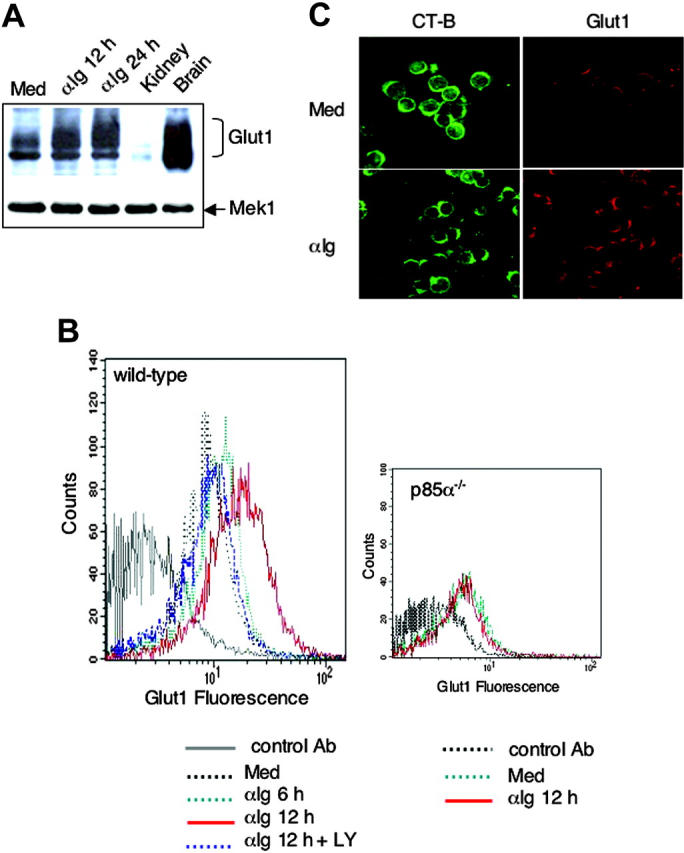
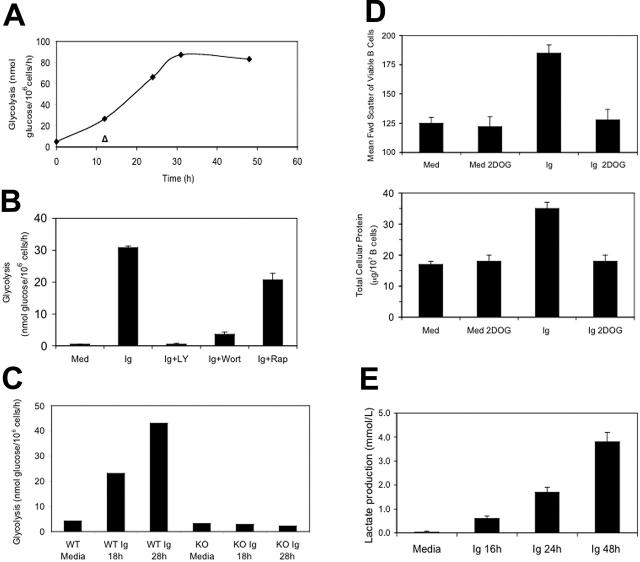
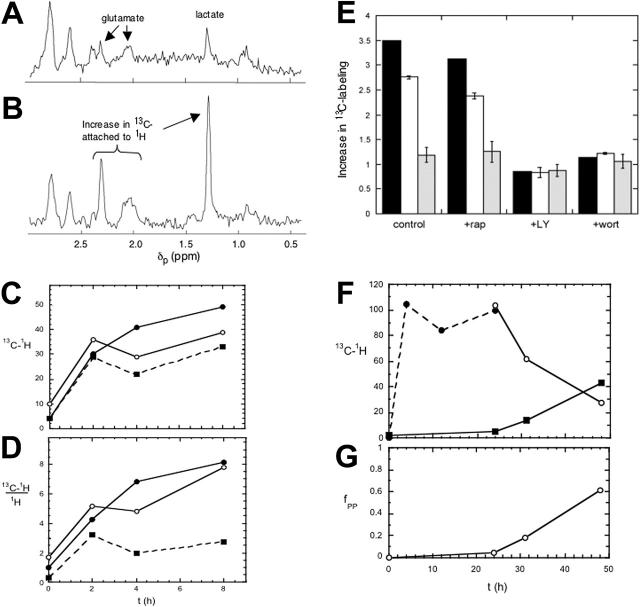
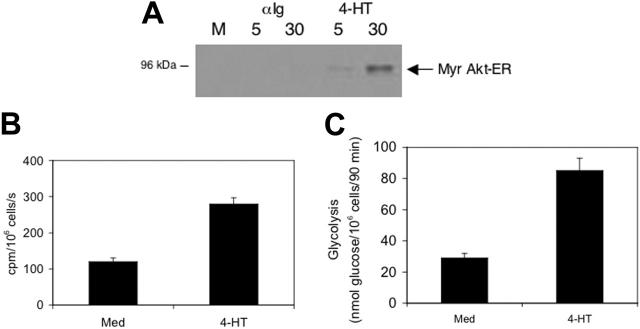
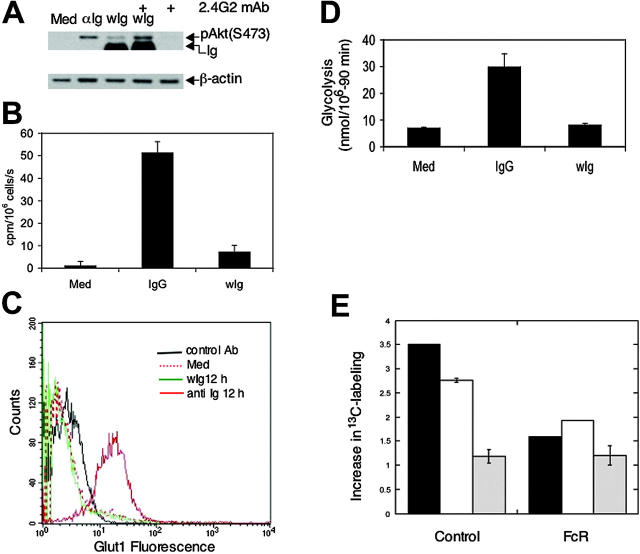
The bioenergetic response of B lymphocytes is subject to rapid changes following antigen encounter in order to provide ATP and anabolic precursors necessary to support growth. However, the pathways involved in glucose acquisition and metabolism are unknown. We find that B lymphocytes rapidly increase glucose uptake and glycolysis following B-cell antigen receptor (BCR) crosslinking. Inhibition of glycolysis blocks BCR-mediated growth. Prior to S-phase entry, glucose metabolism shifts from primarily glycolytic to include the pentose phosphate pathway. BCR-induced glucose utilization is dependent upon phosphatidylinositol 3-kinase (PI-3K) activity as evidenced by inhibition of glucose uptake and glycolysis with LY294002 treatment of normal B cells and impaired glucose utilization in B cells deficient in the PI-3K regulatory subunit p85alpha. Activation of Akt is sufficient to increase glucose utilization in B cells. We find that glucose utilization is inhibited by coengagement of the BCR and FcgammaRIIB, suggesting that limiting glucose metabolism may represent an important mechanism underlying FcgammaRIIB-mediated growth arrest. Taken together, these findings demonstrate that both growth-promoting BCR signaling and growth-inhibitory FcgammaRIIB signaling modulate glucose energy metabolism. Manipulation of these pathways may prove to be useful in the treatment of lymphoproliferative disorders, wherein clonal expansion of B lymphocytes plays a role.


Figures

Figure 1.
Figure 1.
Engagement of the BCR increases glucose uptake in a PI-3K–dependent pathway. (A) Splenic B cells were cultured in the absence (Med) or presence of 10 μg/mL anti-Ig (Ig) for 15 hours. Uptake of 2-[3H]deoxyglucose was measured for 60 seconds in the presence or absence of 10 μM cytochalasin B. Transport represents the difference between the total 2-[3H]deoxyglucose uptake (cpm/106 cells/sec) minus uptake in the presence of 10 μM cytochalasin B. (Inset) Splenic B cells were cultured in the presence of 10 μg/mL anti-Ig (Ig) for 15 hours. Cells were collected, and the initial uptake of 2-[3H]deoxyglucose was measured for the indicated times (in seconds) in the presence (bottom line) or absence (top line) of 10 μM cytochalasin B as described in “Materials and methods.” The data indicate that uptake of 2-[3H]deoxyglucose in anti-Ig–stimulated B cells is linear for 90 seconds. (B) Parallel B cells were also stimulated with 10 μg/mL anti-Ig (15 hours) in the absence (Ig) or presence of 10 μM LY294002 (Ig+LY), 50 nM wortmannin (Ig+Wort), or 20 nM rapamycin (Ig+Rap). Cells were then harvested, and 2-[3H]deoxyglucose uptake was measured. The inhibitors had no measurable effect on 2-[3H]deoxyglucose uptake in B cells cultured in medium alone (data not shown). Error bars reflect standard deviation from the mean of triplicate measurements, and the data for panels A-B are representative of 3 independent experiments. (C) B cells were pretreated with 10 μM LY294002 (LY), 50 nM wortmannin (Wort), or 20 nM rapamycin (Rap) for 30 minutes and cultured in medium alone (M) or stimulated with 10 μg/mL anti-Ig (αIg) for 15 minutes. Cell lysates were prepared, and phosphorylation of Akt on Ser473 and p70S6K on Thr389 was monitored by Western blot. The data are representative of 4 independent experiments.
Figure 2.
Figure 2.
BCR crosslinking increases Glut1 expression. (A) B cells were cultured in the absence (Med) or presence of 10 μg/mL anti-Ig (αIg) for 12 and 24 hours. Cell lysates were prepared, and equivalent amounts of total protein were examined by Western blot for Glut1 and Mek-1 protein levels; the latter serves as a loading control. Brain and kidney lysates serve as tissue sources expressing relatively high and low levels of Glut1, respectively. (B) B cells were cultured in the absence (Med) or presence of 10 μg/mL anti-Ig (αIg) for 6 and 12 hours, and then Glut1 expression was determined by flow cytometry. Parallel B cells were pretreated for 30 minutes with 10 μM LY294002 and then stimulated with anti-Ig for 12 hours (αIg 12 h + LY). B cells were also isolated from p85α-deficient mice, cultured in the absence (Med) or presence of 10 μg/mL anti-Ig (αIg) for 12 hours, and then Glut1 expression was determined by flow cytometry. In both the wild-type and p85α-deficient analyses, control Ab indicates an isotype-matched control staining of B cells stimulated with 10 μg/mL anti-Ig for 12 hours. In data not shown, the staining of B cells with an anti-MHC Ab was similar in all conditions. (C) B cells were cultured in medium alone (Med) or stimulated with 10 μg/mL anti-Ig (αIg) for 12 hours. Cells were stained with Alexa Fluor 488–conjugated CT-B and anti-Glut1 Ab as described in “Materials and methods.” The data are representative of 3 independent experiments.
Figure 3.
Figure 3.
BCR engagement increases glycolysis in a PI-3K–dependent manner. (A) Quiescent splenic B cells were cultured in the absence (t = 0 hours) or presence of 10 μg/mL anti-Ig (♦). Anti-Ig–stimulated B cells were also cultured with 1 mM 2-DOG (2DOG) for 12 hours (▵). At 90 minutes prior to the indicated times, B-cell cultures were supplemented with [5-3H]glucose, and glycolysis was then measured as described in “Materials and methods.” The standard deviations for each time point are less than 5% of the mean of triplicate measurements, and the data are representative of 3 independent experiments. (B) Glycolysis was conducted in parallel B cells that were pretreated with 10 μM LY294002 (Ig+LY), 50 nM wortmannin (Ig+Wort), or 20 nM rapamycin (Ig+Rap) for 30 minutes and then stimulated with 10 μg/mL anti-Ig (Ig) for 18 hours. The inhibitors had no measurable affect on glycolysis in B cells cultured in medium (Med) alone (data not shown). (C) Splenic B cells from wild-type (WT) and p85α-deficient (KO) mice were cultured in the absence (Media) or presence of 10 μg/mL anti-Ig (Ig). At 90 minutes prior to the indicated times, glycolysis was measured. The standard deviations for each condition are less than 5% of the mean. (D) B cells were cultured in media alone (Med) or stimulated with 10 μg/mL anti-Ig (Ig) for 18 hours in the absence or presence of 1 mM 2-DOG. Cells were then harvested for flow cytometric analysis for size (mean fwd scatter) and total cellular protein content. Protein determinations from total cellular extracts were carried out using a Bio-Rad Protein Assay Dye Reagent according to the manufacturer's recommendations. (E) B cells were cultured in medium alone (Media) or stimulated with 10 μg/mL anti-Ig (Ig) for the indicated times, and the amount of lactate secreted into the tissue culture medium was then measured. The data are represented as millimoles per liter (mmol/L). In panels D-E, error bars reflect standard deviation from the mean of triplicate measurements, and the data are representative of 3 independent experiments.
Figure 4.
Figure 4.
1H NMR spectra of glucose metabolites in B cells. B cells were cultured in medium containing 10 mM [1-13C]glucose in the absence (A) or presence (B) of 10 μg/mL anti-Ig for 8 hours. Cells were then analyzed by 1D-HMQC as described in “Materials and methods.” The 13C from the [1-13C]glucose is metabolized to the lactate methyl group and the glutamate methylenes. (C-D) Incorporation of [1-13C]glucose into the lactate methyl group (▪) and the glutamate C4H2 (•) and C3H2 (○) pools in anti-Ig–stimulated B cells. (C) Integrated intensity of protons coupled to 13C selected in a 1D-HMQC experiment. (D) Specific 13C content of lactate and glutamate pools as a function of time after BCR crosslinking. (E) Incorporation of [1-13C]glucose into metabolites in B cells after BCR crosslinking (8 hours) in the absence (control) and presence of pretreatment (30 minutes) with 10 μM LY294002 (+LY), 50 nM wortmannin (+wort), or 20 nM rapamycin (+rap). The increases in 13C content (compared with the same metabolites in quiescent B cells where 13C content is 1.0) are shown for the lactate methyl group (black bars) and glutamate methylenes (open bars) (the average increase in 13C uptake into each glutamate methylene carbon is shown) and the citrate methylenes (gray bars) as a control. (F) 13C glucose incorporation and metabolism into lactate in response to anti-Ig stimulation of B cells at the indicated times (h); [1-13C]glucose labeling of the methyl group (•); [2-13C]glucose labeling of methyl (▪) and methine groups (○). (G) Fraction of lactate generated by the pentose phosphate pathway based on 13C label distribution in the CH3 group as a function of time after anti-Ig stimulation of B cells incubated with [2-13C]glucose. Integration scales in each type of spectrum are arbitrary.
Figure 5.
Figure 5.
Conditional activation of Akt in A20 B cells increases glucose utilization. (A) A20 cells constitutively expressing an Akt-mER fusion protein were cultured in the absence or presence of 4 μM 4-HT or 10 μg/mL anti-Ig (αIg) for 5 and 30 minutes. Cells were then harvested, and phosphorylation of Akt-mER (Myr Akt-ER) on Ser473 was monitored by Western blot. A20 cells constitutively expressing an Akt-mER fusion protein were cultured in the absence or presence of 4 μM 4-HT for 24 hours, and then uptake of 2-[3H]deoxyglucose (B) and glycolysis (C) was measured as described in “Materials and methods.” In panels B-C, error bars reflect standard deviation from the mean of triplicate measurements.
Figure 6.
Figure 6.
Cocrosslinking the BCR and FcγRIIB inhibits BCR-induced glucose utilization. (A) B cells were cultured in medium alone (Med) or 10 μg/mL F(ab′)2 fragments of anti–mouse IgG (αIg) for 15 minutes. Parallel B cells were cultured with 10 μg/mL intact anti–mouse IgG (wIg) in the presence or absence of 10 μg/mL 2.4G2 mAb. Cells were then evaluated for phosphorylation of Akt on Ser473 and β-actin by Western blot. (B) B cells were cultured in medium alone (Med), 10 μg/mL F(ab′)2 fragments of anti–mouse IgG (IgG), or 10 μg/mL intact anti–mouse IgG (wIg) for 12 hours. Cells were then assayed for 2-[3H]deoxyglucose uptake as described in Figure 1. (C) Glut1 expression was monitored by flow cytometry in B cells cultured in medium alone (Med) and stimulated with 10 μg/mL F(ab′)2 fragments of anti–mouse IgG (anti Ig) for 12 hours or with 10 μg/mL intact anti–mouse Ig (wIg) for 12 hours. Control Ab indicates an isotype-matched control staining of B cells stimulated with 10 μg/mL F(ab′)2 fragments of anti–mouse IgG for 12 hours. In data not shown, the staining of B cells with an anti-MHC Ab was similar in all conditions. (D) Glycolysis was measured in B cells cultured as described in panel B. In panels B and D, error bars reflect standard deviation from the mean of triplicate measurements. The data are representative of 3 independent experiments. (E) Incorporation of [1-13C]glucose into metabolites in B cells stimulated with 10 μg/mL F(ab′)2 fragments of anti–mouse IgG (control) for 8 hours as described in Figure 4E. In parallel, B cells were cultured with 10 μg/mL intact anti–mouse Ig (FcR). The increases in 13C content (compared with the same metabolites in quiescent B cells where the 13C content is 1.0) are shown for the lactate methyl group (black bars), glutamate methylenes (open bars) (the average increase in 13C uptake into each glutamate methylene carbon is shown), and the citrate methylenes (gray bars).

Similar articles

Cited by

References

    1. DeFranco AL, Raveche ES, Paul WE. Separate control of B lymphocyte early activation and proliferation in response to anti-IgM antibodies. J Immunol. 1985;135: 87-94. - PubMed
    1. Sieckmann DG. The use of anti-immunoglobulins to induce a signal for cell division in B lymphocytes via their membrane IgM and IgD. Immunol Rev. 1980;52: 181-210. - PubMed
    1. Schuhmacher M, Staege MS, Pajic A, et al. Control of cell growth by c-Myc in the absence of cell division. Curr Biol. 1999;9: 1255-1258. - PubMed
    1. Iritani BM, Eisenman RN. c-Myc enhances protein synthesis and cell size during B lymphocyte development. Proc Natl Acad Sci U S A. 1999;96: 13180-13185. - PMC - PubMed
    1. Buttgereit F, Burmester GR, Brand MD. Bioenergetics of immune functions: fundamental and therapeutic aspects. Immunol Today. 2000;21: 192-199. - PubMed

Publication types